British Pound Price Prediction – July 20
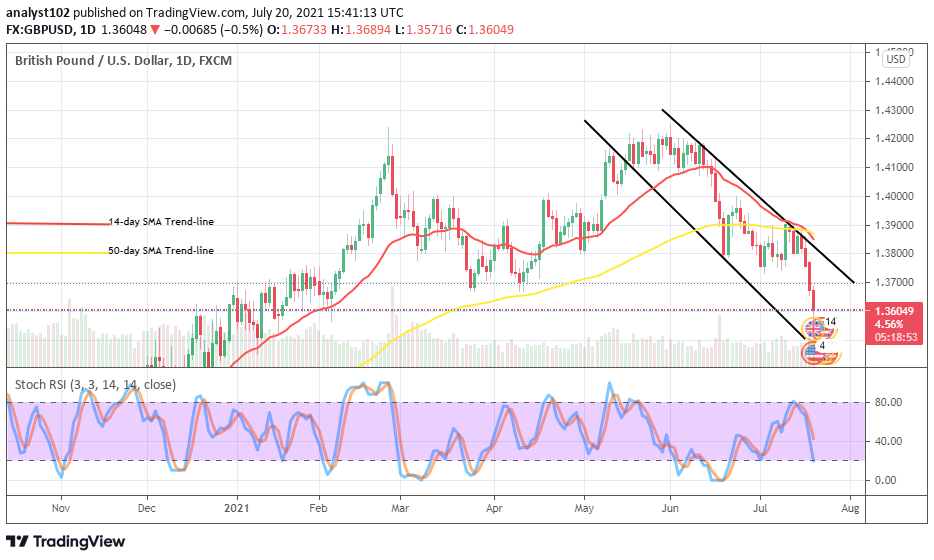
The GBP/USD financial book records that the currency pair’s price drops sharply to approach the lower support trading area of 1.3600. The market’s percentage rate stands at -0.46.
GBP/USD Market
Key Levels:
Resistance levels: 1.3700, 1.3800, 1.3900
Support levels: 1.3500, 1.3400, 1.3300
GBP/USD – Daily Chart
The GBP/USD daily chart showcases that the currency pair’s price drops sharply after hitting resistance around the point of 1.3800. A bearish candlestick shows the market valuation at around 1.3600 or thereabout. The bearish channel trend lines are most relevant in the determination of this market’s trend. The SMA trading indicators are lagging as the 14-day SMA has just intercepted the 50-day SMA to the southward. The Stochastic Oscillators have bent southbound, close to the range of 20. To what extent could the present down forces go as the GBP/USD price drops sharply?
The present down force carries a high catalyst to devoid the possibility of swinging at the near session. On July 16, a bearish candlestick formed against the line of 1.3800, leading the trade into a lower trading zone. Bulls’ making a come-back isn’t technically ideal for now as they needed to suspend their positions until a while.
On the downside analysis, the GBP/USD bears have had a better chance to continue pushing the market southward further based on the weight of the current downward force. As the Stochastic Oscillators point southward portends a sign that the currency pair’s market is under a heavy falling pressure that could place bulls’ action on a decimation trading style.
Summarily, The GBP/USD market operation has been dominated by downward forces, now giving bears an upper hand over bulls. Therefore, some of the positions that needed to gain top priority are sell orders. It could sometimes be before a decent support surfaces again in this currency pair. GBP/USD 4-hour Chart
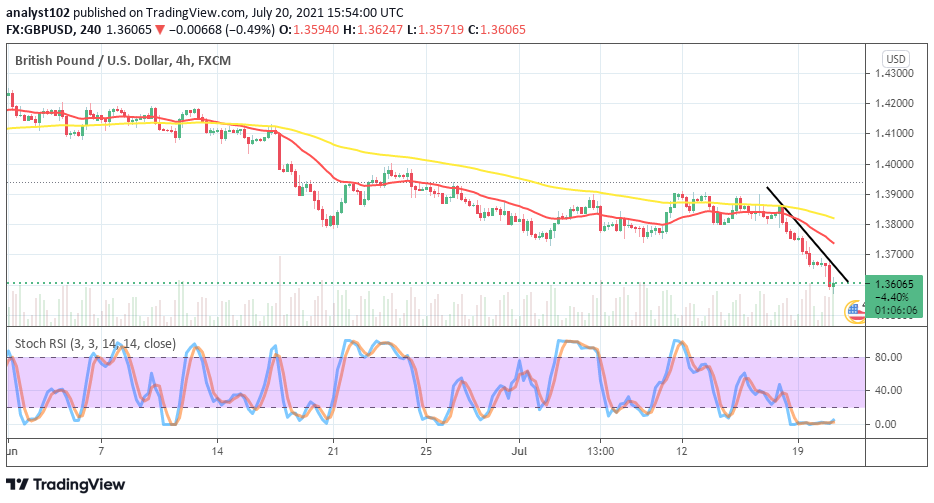
A downward trend has formed in the wake of variant bearish candlesticks that appeared on the downside of the SMAs. The 50-day SMA indicator is over the 14-day SMA indicator. The bearish trend-line drew downward across the trend lines of the SMAs. The Stochastic Oscillators are in the oversold region with the two lines conjoined, moving in a consolidation manner to affirm the current downward forces in the currency pair trading activities.
Note: Forexschoolonline.com is not a financial advisor. Do your research before investing your funds in any financial asset or presented product or event. We are not responsible for your investing results.
Learn to Trade Forex Online
GBP/USD Price Drops Sharply
Footer

ForexSchoolOnline.com helps individual traders learn how to trade the Forex market
WARNING: The content on this site should not be considered investment advice and we are not authorised to provide investment advice. Nothing on this website is an endorsement or recommendation of a particular trading strategy or investment decision. The information on this website is general in nature so you must consider the information in light of your objectives, financial situation and needs.
Investing is speculative. When investing your capital is at risk. This site is not intended for use in jurisdictions in which the trading or investments described are prohibited and should only be used by such persons and in such ways as are legally permitted. Your investment may not qualify for investor protection in your country or state of residence, so please conduct your own due diligence or obtain advice where necessary. This website is free for you to use but we may receive a commission from the companies we feature on this site.
We Introduce people to the world of currency trading. and provide educational content to help them learn how to become profitable traders. we're also a community of traders that support each other on our daily trading journey
Forexschoolonline.com is not a financial advisor. Do your research before investing your funds in any financial asset or presented product or event. We are not responsible for your investing results.

Leave a Reply