GBP/USD Price Prediction – July 18
In the recent operations, the GBP/USD market declined to now appears, finding support around 1.1800. The pairing coins are trading between 1.1874 and 1.1803 at a minimal positive percentage rate of 0.37.
GBP/USD Market
Key Levels:
Resistance levels: 1.2000, 1.2100, 1.2200
Support levels: 1.1800, 1.1700, 1.1600
GBP/USD – Daily Chart
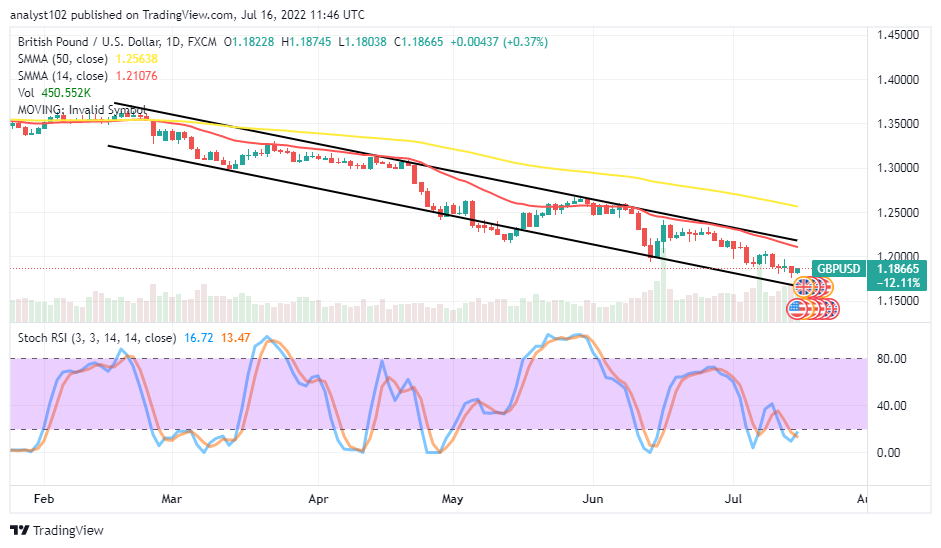
The GBP/USD daily chart showcases the currency pair price appears, finding support around the 1.1800 level. The upper bearish trend line drew around the smaller-SMA indicator. The 50-day SMA trend line is above the 14-day SMA trend line. The Stochastic Oscillators are in the oversold region, seemingly trying to cross northbound closely below the range of 20. That shows the base currency is struggling to push back against the counter-fiat coin. Will declining forces still prevail over the other directions in the GBP/USD market operations?
From the technical reading outlook of the GBP/USD market operations on a long-term basis, the price tends to encounter resistance around 1.2107 after pushing maximally from beneath the trend lines of the SMAs. There can be a complementary agreement between a 1-hour and 4-hour charts at a lower point to, later on, suggest a decent buying order provided the 1.1800 support line won’t breach southward.
On the downside of the technical analysis, as there has been a smaller bullish candlestick in the making, the GBP/USD market bears may have to be on the lookout for an active correction against the motion to re-launch a sell order. But, it has to be timely to avoid unnecessary whipsaw that may crop up.
In summary, the GBP/USD market operation may, for a while, push northward toward resistance of around 1.2107 before probably resorting to a declining pressure afterward. But, if the market holds above it sustainably, the price will potentially move higher toward 1.2563 resistance. GBP/USD 4-hour Chart
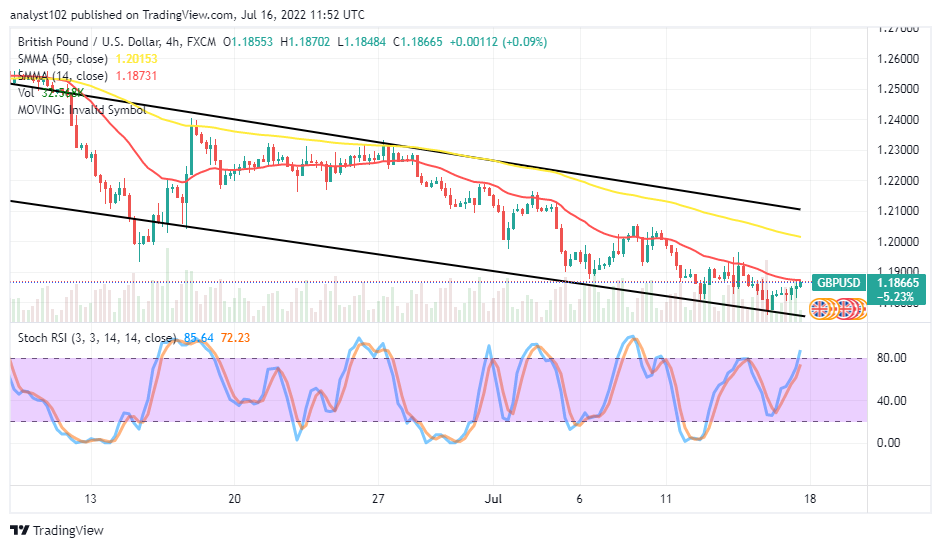
The GBP/USD 4-hour chart reveals the currency pair price appears, finding support around the 1.1800 support level. The trend lines of the SMAs enclosed within the bearish channels. The 14-day SMA indicator is underneath the 50-day SMA indicator. It has indicated that the market may decline if unable to break northward past the resistances of 1.1873 and 1.2015 in the medium-term run. The Stochastic Oscillators have briefly penetrated the overbought region. The gravitational force of the market to the upside appears to reduce gradually. Therefore, a correction may in no time take effect.
Note: Forexschoolonline.com is not a financial advisor. Do your research before investing your funds in any financial asset or presented product or event. We are not responsible for your investing results.


Leave a Reply