GBP/USD Price Prediction – October 17
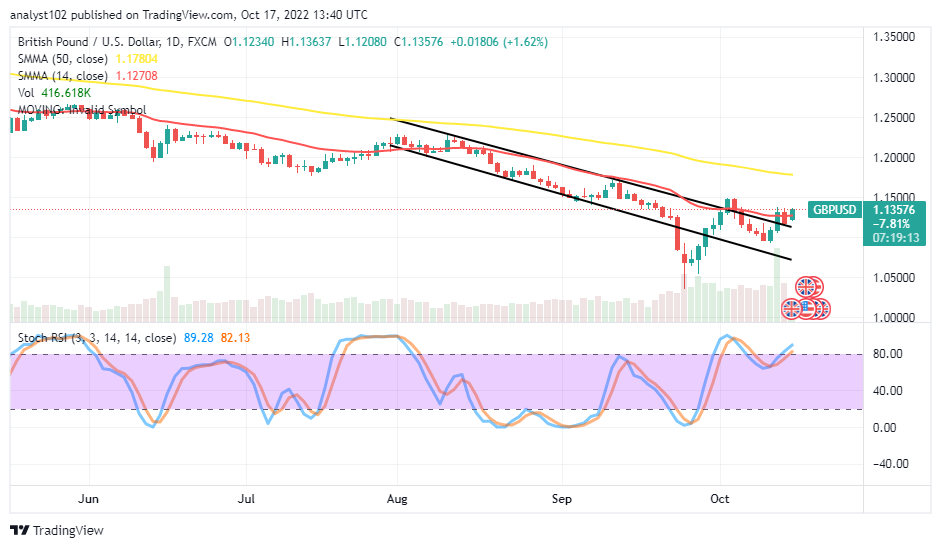
It shows that the GBP/USD market advances resistance line 1.1500 in a bid to exhaust forces to the upside to find a markdown point. The present trading situation has been between 1.1367 and 1.12080 points, with an opening balance of 1.12340 to trade at 1.13576 at an average positive percentage rate of 1.62.
GBP/USD Market
Key Levels:
Resistance levels: 1.15, 1.1600, 1.1700
Support levels: 1.1200, 1.1100, 1.1000
GBP/USD – Daily Chart
The daily chart reveals the GBP/USD price advances resistance line 1.1500. A bullish candlestick is in the making against the smaller SMA. The 14-day SMA indicator is at 1.12708, underneath the 1.17804 value line of the 50-day SMA indicator. The bearish channels are below the bigger SMA trend line. The Stochastic Oscillators are facing the northbound slightly against the 80 range point at 82.13 and 89.68 range values. Will the GBP/USD trade survive to push beyond the 1.1500 resistance level?
It may be difficult for the GBP/USD market to push beyond the 1.1500 resistance level because the value line seems to be the critical zone against getting a smooth upward run as the pairing currency advances it. At this point, buyers need not ride alongside any attempted move that price tends to make afterward to avoid a whipsaw in no time.
The downside of the technical sentiment, the GBP/USD market will have to undergo depressions below the sell signal side of the bigger SMA trend line. A 1-hour trading chart is needed to detect an early shorting entry around the 1.1500 resistance level.
In summary, It appears that the GBP/USD market operation is approaching a high-resistance trading spot that bears will have to take advantage of pushing southward soon. But, sellers need to be wary of fearful holding of price above the 1.1500 resistance level. GBP/USD 4-hour Chart
The GBP/USD medium-term chart showcases the currency pair price advances to the 1.1500 resistance level. The 14-day SMA trend line has managed to join the 50-day SMA trend line from beneath, envisaging trying to shift further north past it. The Stochastic Oscillators have crossed northbound at 52.75 and 69.19 range values to suggest an upward-rending move is ongoing to make completion of bullish forces that can give birth to a resumption of declines soon.
Note: Forexschoolonline.com is not a financial advisor. Do your research before investing your funds in any financial asset or presented product or event. We are not responsible for your investing results.
Learn to Trade Forex Online
GBP/USD Price Advances Resistance Line 1.1500
Footer

ForexSchoolOnline.com helps individual traders learn how to trade the Forex market
WARNING: The content on this site should not be considered investment advice and we are not authorised to provide investment advice. Nothing on this website is an endorsement or recommendation of a particular trading strategy or investment decision. The information on this website is general in nature so you must consider the information in light of your objectives, financial situation and needs.
Investing is speculative. When investing your capital is at risk. This site is not intended for use in jurisdictions in which the trading or investments described are prohibited and should only be used by such persons and in such ways as are legally permitted. Your investment may not qualify for investor protection in your country or state of residence, so please conduct your own due diligence or obtain advice where necessary. This website is free for you to use but we may receive a commission from the companies we feature on this site.
We Introduce people to the world of currency trading. and provide educational content to help them learn how to become profitable traders. we're also a community of traders that support each other on our daily trading journey
Forexschoolonline.com is not a financial advisor. Do your research before investing your funds in any financial asset or presented product or event. We are not responsible for your investing results.

Leave a Reply