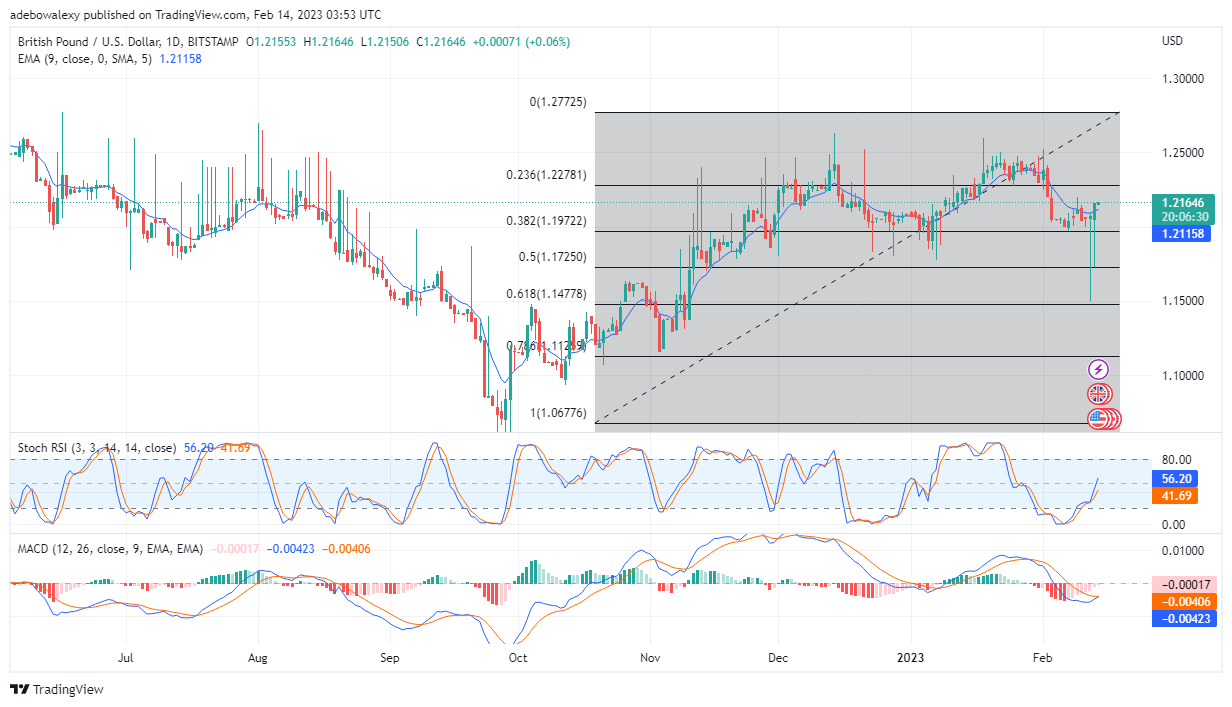
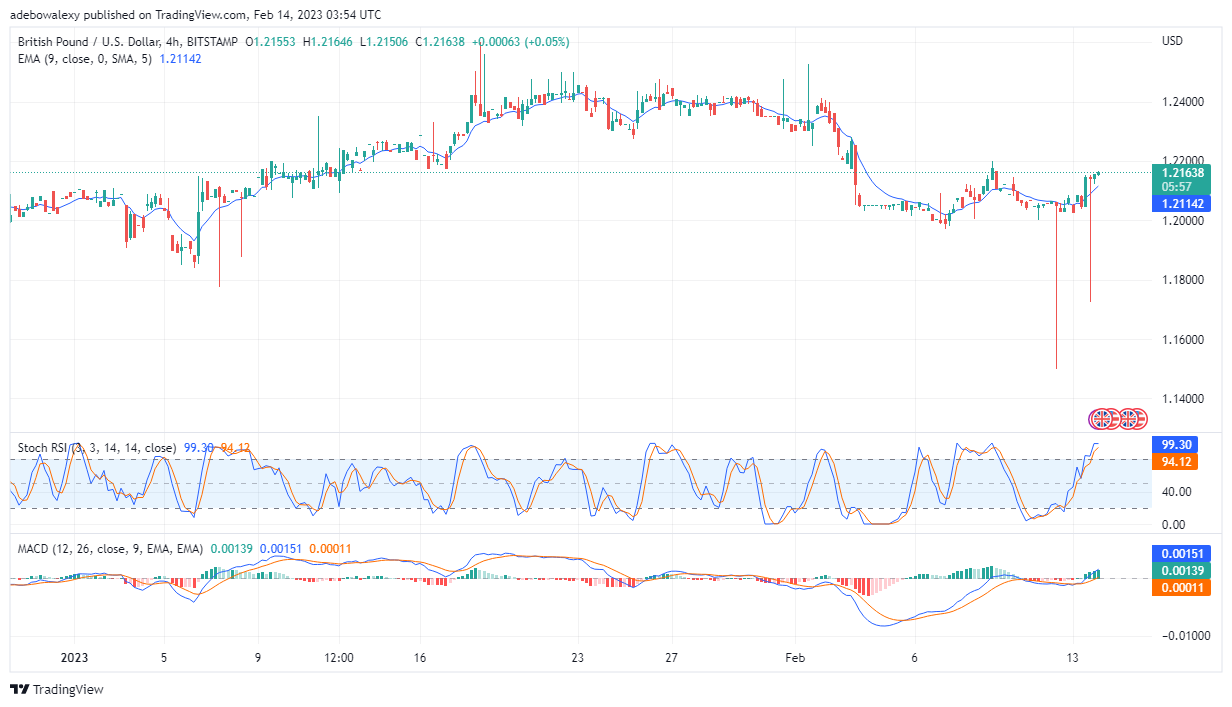
Price activity in the GBP/USD market appears ready to continue its upside move. Technical indicators are revealing that the price action in this market may be on the verge of receiving an additional tailwind.
Major Price Levels:
Top Levels: 1.2164, 1.2194, 1.2230
Floor Levels: 1.2144, 1.2114, 1.2088

GBP/USD Is Ready to Gain More Upwards Traction
Another trading session has begun in favor of buyers in the GBP/USD daily market. Here, we could see that another green price candlestick has formed clearly above the 9-day MA curve. Consequently, this reveals that price action may have taken a decisive leap to the upside. Furthermore, RSI indicator lines have been consistently rising toward level 50. Meanwhile, the MACD indicator lines have converged at their tips for a crossover, and its histogram bars have vanished into the 0.00 level. The signs from the RSI and MACD portray that a tailwind is lurking and may be on the verge of bursting forth.

GBP/USD Continues on Its Upward Path
Moving to the 4-hour market, it could be seen that prices have continued to form above the MA line. The MACD curve has kept on rising steadily above the 0.00 level of the indicator. Although the lines of the RSI indicator have kept moving upward, one could easily see how jagged they look. The appearance of the RSI lines seems to portray that price action has been up against downward forces, nevertheless, the tailwind has remained more dominant. Traders should notice the green histogram bars on the MACD, as it reveals that upside forces are strong. Therefore, it’s more likely that the price will keep moving toward the 1.2250 mark.
Do you want to take your trading to the next level? Join the best platform for that here.


Leave a Reply