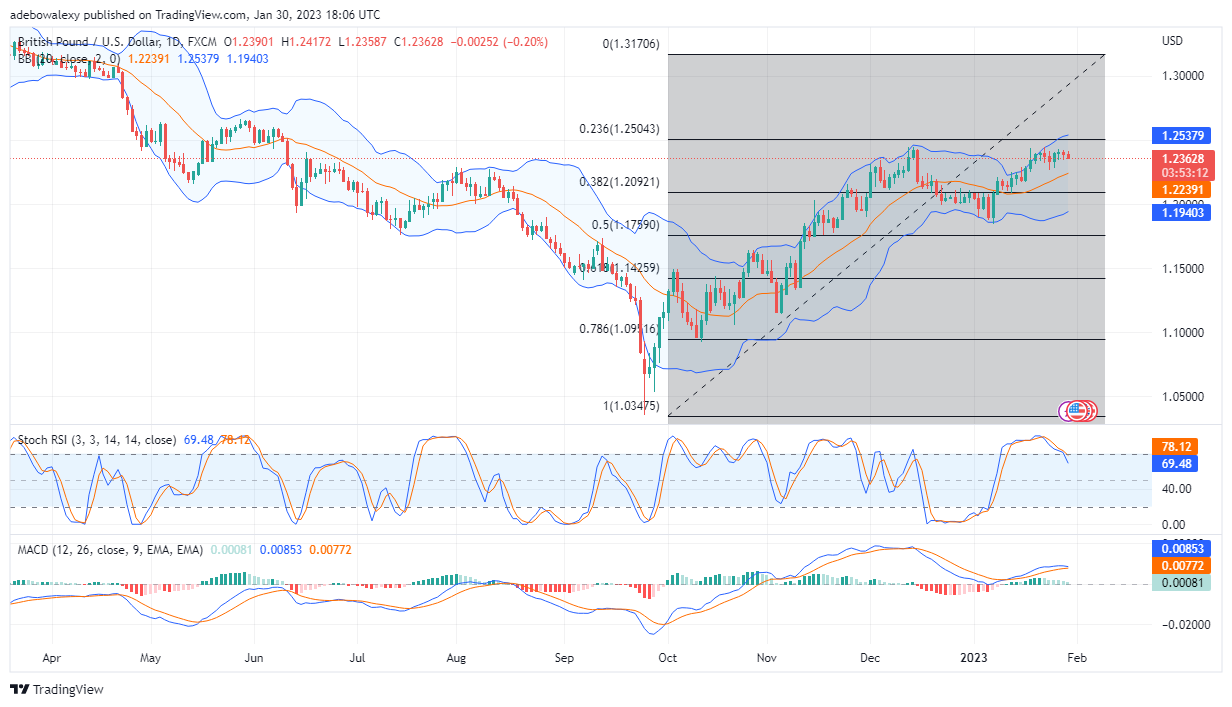
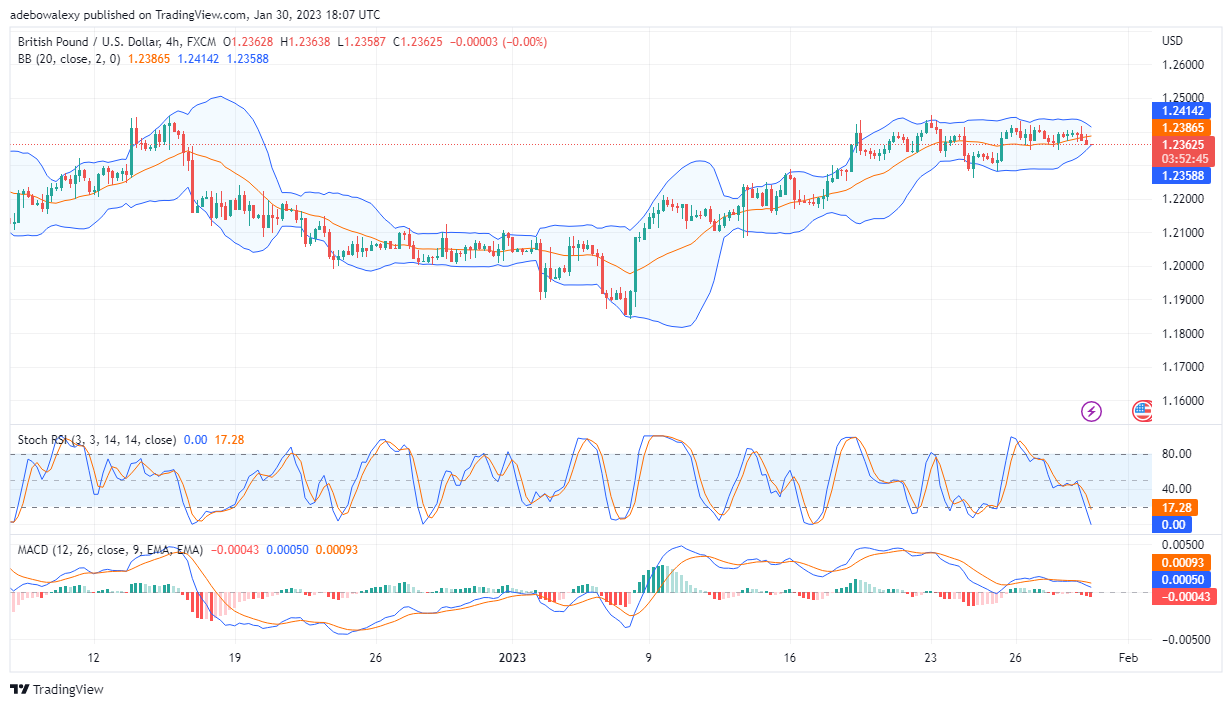
Price action in the GBP/USD market at this point looks choppy in recent times, And at this point price action seems set to fall to lower support, considering the appearance of price candles and signs from technical indicators in most recent times.
Major Price Levels:
Top Levels: 1.2367, 1.2400, 1.2420
Floor Levels: 1.2337, 1.2300, 1.23270

Price Action in the GBP/USD Market Its Extends Downward Retracement
The latest price candle on the daily GBP/USD market has further extended the price decrease. This price candle is a bearish one and looks significantly bigger than the previous one. Consequently, price action seems to have fallen closer to the MA line as support. Also, the Stochastic RSI indicator lines seem to have taken a more downward bearing at this point, showing that downward forces are stronger now. Meanwhile, the MACD indicator lines have now moved closer to each other above the 0.00 mark, indicating a bearish crossover. Also, we can see that the bars of the MACD indicator are now pale green in appearance, which indicates an increase in price downward momentum.

GBP/USD Downward Retracement Continues
The price decline in the GBP/USD market appears to be getting stronger. On the 4-hour market, price action has crossed below the middle limit of the Bollinger band indicator. And this seems to indicate a much stronger downward retracement. However, the RSI curves have reached very deep in the oversold region and are now at 17.00 and 0.00 levels. Also, the line of the MACD indicator is now falling toward the equilibrium level. Additionally, the downward force appears to be stronger based on the histogram bars on the MACD indicator. Consequently, traders can expect that the GBP/USD price may fall to the 1.2300 level shortly.
Do you want to take your trading to the next level? Join the best platform for that here.


Leave a Reply