GBP/USD keeps gathering moderate profit, even as price action on the daily market continues to tackle a higher price resistance level. At the same time, trading indicators are also showing fair signs that the pair is likely to further extend its profitability. Let’s get a closer view of price movement in this market.
Major Price Levels:
Top Levels: 1.2283, 1.2347, and 1.2410
Floor Levels: 1.2243, 1.2200, and 1.2150

GBP/USD Advances Towards the Fibonacci Retracement 23.60
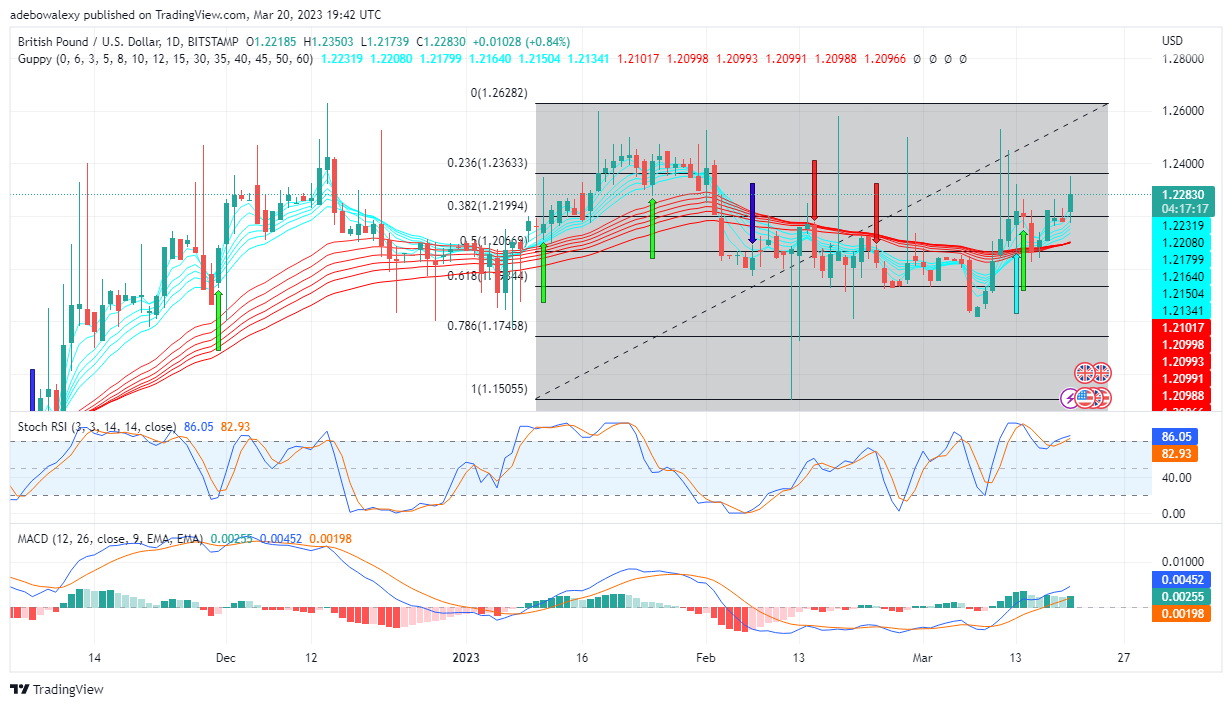
The GBP/USD price movement on the daily chart stays largely optimistic about a further price increase. The latest price candle that has appeared on this market has further pushed the price above the two sets of the Guppy Multiple Moving Average. Likewise, the curves on the Stochastic RSI have continued to move slightly upward. Meanwhile, the bars of the MACD indicator have regained their solid green appearance. Also, one can perceive that the lines of the MACD are still trending upward above the 0.00 level. Therefore, this shows that price action will most probably move further upward.

GBP/USD Price Action Upside Hope Stays Alive
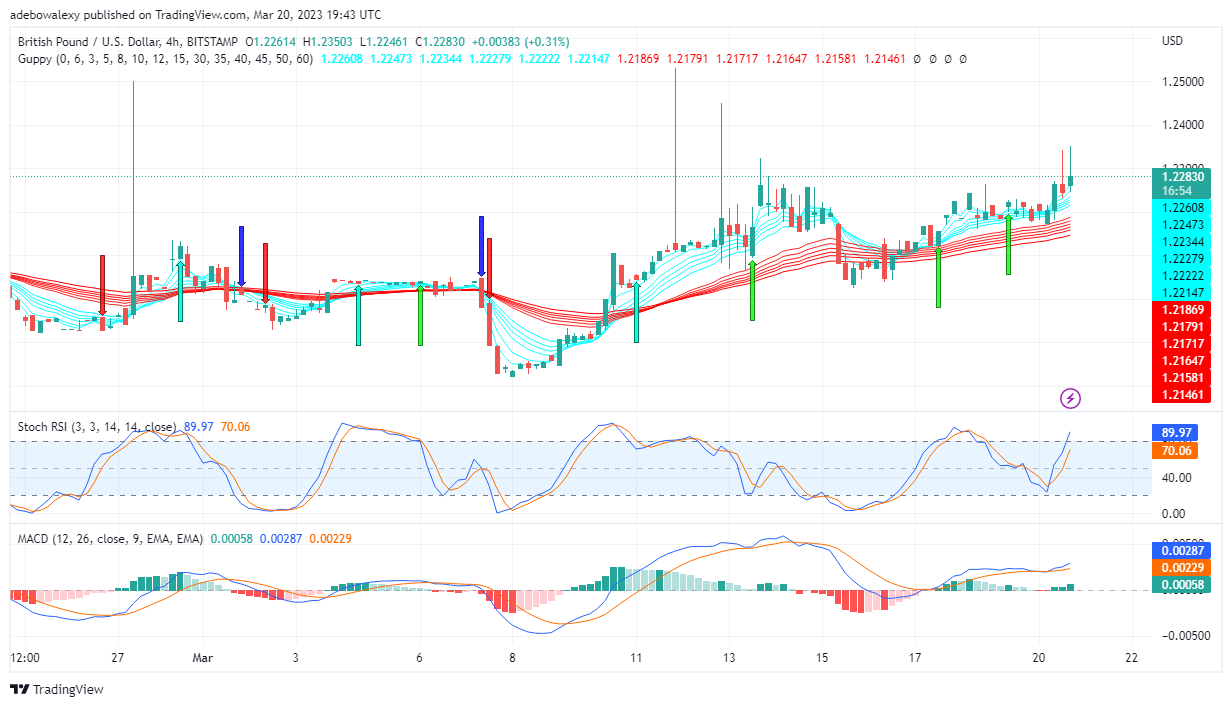
The GBP/USD 4-hour market reveals that price action continues to pressurize the price mark of 1.2300. The wick of the last price candle can be seen rising above 1.2300. However, the current price of the pair remains under the 1.2300 price mark. Also, the two sets of the GMMA curve stay under the last three price candles. Furthermore, the RSI curve can be seen trending steeply upwards with a considerable distance between the two curves. Additionally, the MACD curves continue to trend upward above the 0.00 level following a bullish crossover. Technically, market signs are positive about price action breaking the 1.2300 level shortly.
Do you want to take your trading to the next level? Join the best platform for that here.
AUD/USD Bulls Face Exhaustion at the Price Resistance Level of 0.6728


Leave a Reply