British Pound Price Prediction – August 17
The GBP/USD market now succumbs slightly downward in its trading activities as the currency pair’s price trades at a -0.29 percentage rate at the level of around 1.3800 as of writing. The slight downward movement in the market appears to be in an increasing mood in the subsequent trading sessions.
GBP/USD Market
Key Levels:
Resistance levels: 1.3900, 1.4000, 1.4100
Support levels: 1.3700, 1.3600, 1.3500
GBP/USD – Daily Chart
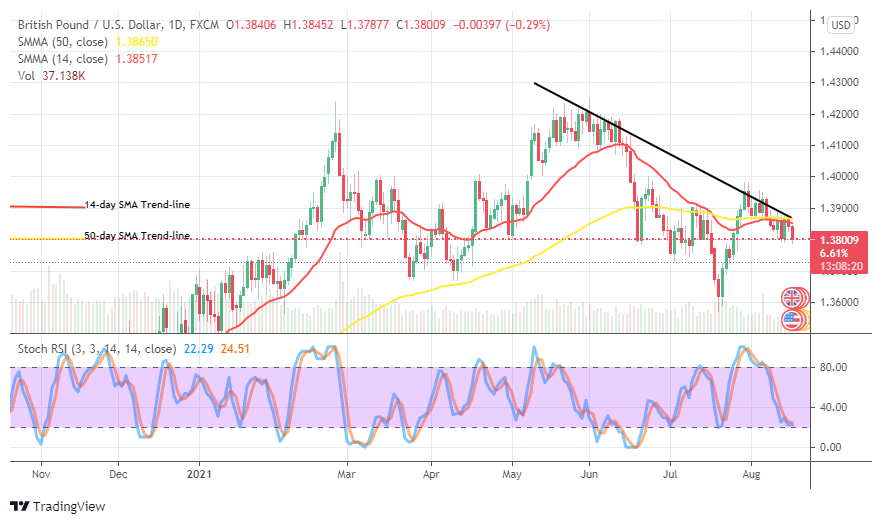
It now reveals on the GBP/USD daily chart that the currency pair market succumbs slightly downward in its valuation. Variant Japanese trading candlesticks have formed in an attempt to break past down the line at 1.3800. The 14-day SMA trend-line has moved upward to align in a southward-curving posture closely beneath the 50-day SMA trend-line. The Stochastic Oscillators have moved down near the range 20. They now appear to close the lines to probably indicate a pause in the trading situation of the pairing fiat coins. Would there be continuity in the current trading situation as the market succumbs slightly downward?
An active price movement is required to now be able to detect what could be the next direction that the GBP/USD trade follow as even that the market succumbs slightly downward. A forceful push against the 1.3800 will cause a trading moment that makes the market re-find support in a lower trading zone.
On the downside, the GBP/USD market bears would have to add more to energies possessed in the market to force the market down further through some of the support lines. That said, the reading of the Stochastic Oscillators suggests that the downward pushing strength appears fading off on a gradual note. That portends the warning against expecting a further free-fall movement afterward.
Summarily, the GBP/USD market operation may still experience a downward force in its valuation. But, cautiousness is needed to exercise by traders intending to go short on the currency pair. However, if a sudden hike in price against the resistance line at 1.3900, the downward motion would mean to have ended. GBP/USD 4-hour Chart
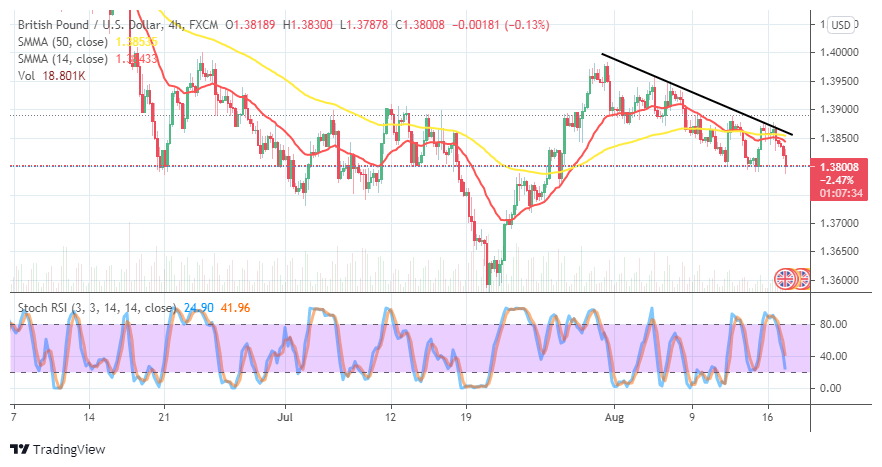
It’s a bit more clearer on the GBP/USD 4-hour chart that the market succumbs to a downward motion. The 14-day SMA indicator has crossed southward closely underneath the 50-day SMA indicator. A full-body bearish candlestick is the making to indicate that the currency pair is under falling pressure. The Stochastic Oscillators have crossed southbound briefly past the range 40, backing the current downward forces.
Note: Forexschoolonline.com is not a financial advisor. Do your research before investing your funds in any financial asset or presented product or event. We are not responsible for your investing results.
Learn to Trade Forex Online
GBP/USD Market Succumbs Slightly Downward
Footer

ForexSchoolOnline.com helps individual traders learn how to trade the Forex market
WARNING: The content on this site should not be considered investment advice and we are not authorised to provide investment advice. Nothing on this website is an endorsement or recommendation of a particular trading strategy or investment decision. The information on this website is general in nature so you must consider the information in light of your objectives, financial situation and needs.
Investing is speculative. When investing your capital is at risk. This site is not intended for use in jurisdictions in which the trading or investments described are prohibited and should only be used by such persons and in such ways as are legally permitted. Your investment may not qualify for investor protection in your country or state of residence, so please conduct your own due diligence or obtain advice where necessary. This website is free for you to use but we may receive a commission from the companies we feature on this site.
We Introduce people to the world of currency trading. and provide educational content to help them learn how to become profitable traders. we're also a community of traders that support each other on our daily trading journey
Forexschoolonline.com is not a financial advisor. Do your research before investing your funds in any financial asset or presented product or event. We are not responsible for your investing results.

Leave a Reply