GBP/USD Price Prediction – February 1
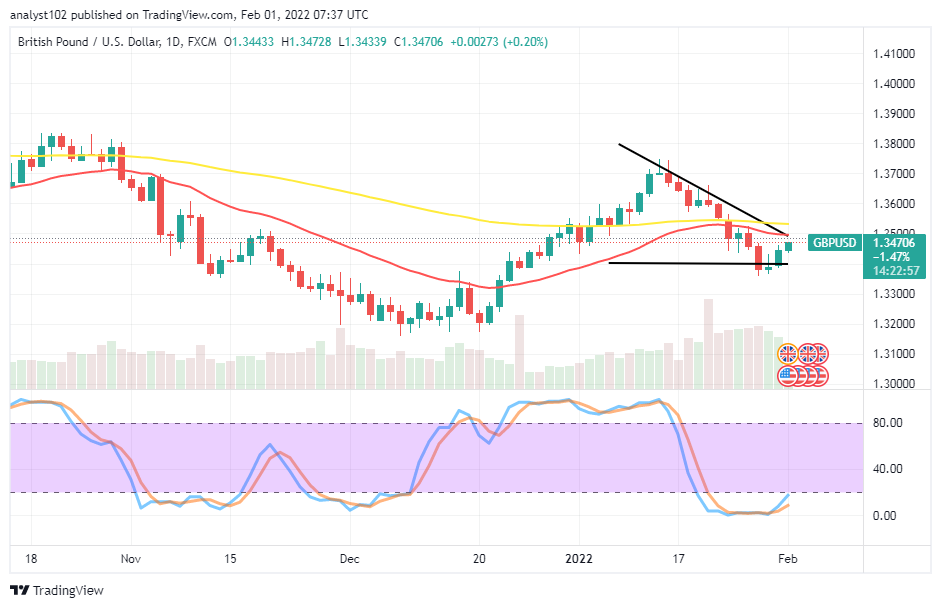
The GBP/USD market currently struggles for recovery after witnessing a long-run of price correction that occurred recently. The currency pair is now trading within the high and low of 1.3472 and 1.3433 at a minute positive percentage of 0.20.
GBP/USD Market
Key Levels:
Resistance levels: 1.3500, 1.3600, 1.3700
Support levels: 1.3400, 1.3300, 1.3200
GBP/USD – Daily Chart
The GBP/USD daily chart showcases the currency pair market struggles for recovery after suffering from a correctional motion lately. On January 28th, a smaller bullish candlestick emerged closely from beneath the 1.3400 support level, signaling the beginning of the current recovery journey of the business transactions. The 14-day SMA has curved southward beneath the 50-day SMA indicator. The Stochastic Oscillators have crossed northbound closer to the range of 20. That signifies the possibility of witnessing some upward pressures soon. Will the GBP/USD trade elongate its movements to the upside as the currency pair market struggles for a recovery?
The GBP/USD trade operation may elongate its movements to the upside for a while as the currency pair market struggles for recovery. The current trading outlook overwhelmingly signifies that some northward momentums are still imminent. Therefore, long-position takers have to be cautious of getting decent buying entry orders.
On the downside of the technical analysis, the GBP/USD market short-position takers may have to suspend their entries. The reading of the Stochastic Oscillators in the oversold region indicates that upward pressure will prevail heavily in the subsequent sessions to make the moment of ordering a sell order unrealistic in the near time.
In summary, the GBP/USD trade activities are likely to witness variant long runs for some time in the following transactions. Therefore, the launching of sell order positions may have to suspend for a while until some of the previous higher resistances are revisited.  GBP/USD 4-hour Chart
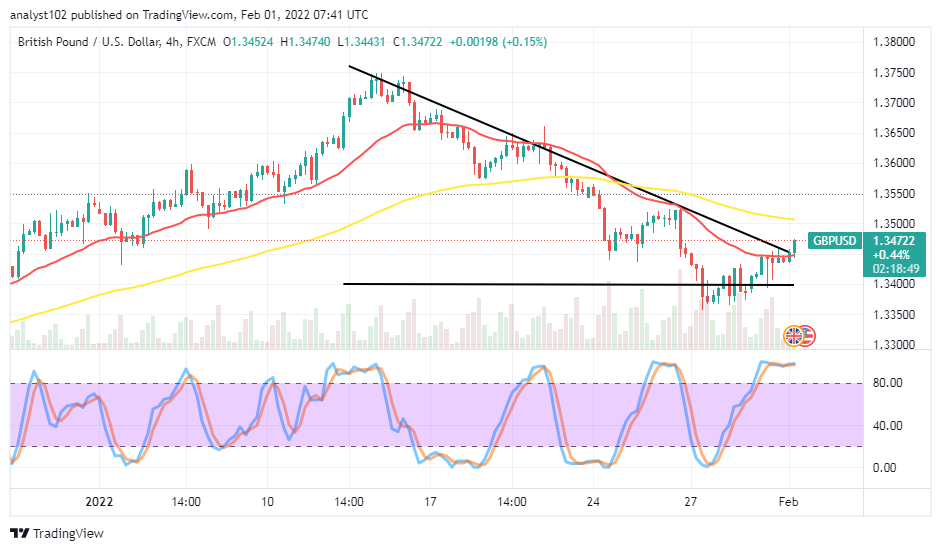
The GBP/USD medium0term chart shows that the currency pair market struggles for recovery. The baseline is drawn at 1.3400 underneath the SMA trend lines to mark the value line where an upswing began to feature. The bearish trend line is alongside the 14-day SMA indicator below the 50-day SMA indicator. The Stochastic Oscillators are in the overbought region with their lines conjoined. A bullish candlestick emerged, indicating the market is consolidating its stances in favor of the upside motions presently. However, An indication also suggests that long-position traders should be wary of a sudden reversal against the current recovery forces.
Note:Forexschoolonline.com is not a financial advisor. Do your research before investing your funds in any financial asset or presented product or event. We are not responsible for your investing results.


Leave a Reply