GBP/USD Price Prediction – May 31
In the wake of trying not to give a damn easily to a downward-returning trend in the GBP/USD trade operations, the currency pair market springs upward with a less volatility index. It observed price trades between the high of 1.2654 and a low of 1.2590 at a minimal percentage rate of 0.20 negative.
GBP/USD Market
Key Levels:
Resistance levels: 1.2700, 1.2800, 1.2900
Support levels: 1.2500, 1.2400, 1.2300
GBP/USD – Daily Chart
The GBP/USD daily chart reveals the currency pair market springs upward with less volatility, briefly past a resistance point around the smaller SMA. The 50-day SMA indicator is above the 14-day SMA indicator. And there is a space separating them apart. The Stochastic Oscillators are in the overbought region, moving in a consolidation manner to denote pressure to the upward side isn’t losing the strength for now. Will the GBP/USD market hold positions to spring up more in the subsequent operations?
There is a need for a convergence of candlesticks to form around the resistances of 1.2700 and 1.2800 levels to complete a rallying process in the GBP/USD market operations. If that assumption has to materialize, it won’t be technically ideal to launch a new buying order entry to avoid not getting whipsawed by an unnecessary correction that is possible to surface in no time.
On the downside of the technical analysis, the GBP/USD market sellers have to be on the lookout for several rejections of price actions around the resistances outlined above. There is a psychological area of resistance trading closely above the 1.2600 as it had several days back. And the market is facing it again under the reading of an overbought condition to have a clear-cut probability that the market will soon witness a decline.
Summarily, the overall verdict suggests bears will soon regain the GBP/USD market control in the near time around the resistance levels outlined above. GBP/USD 4-hour Chart
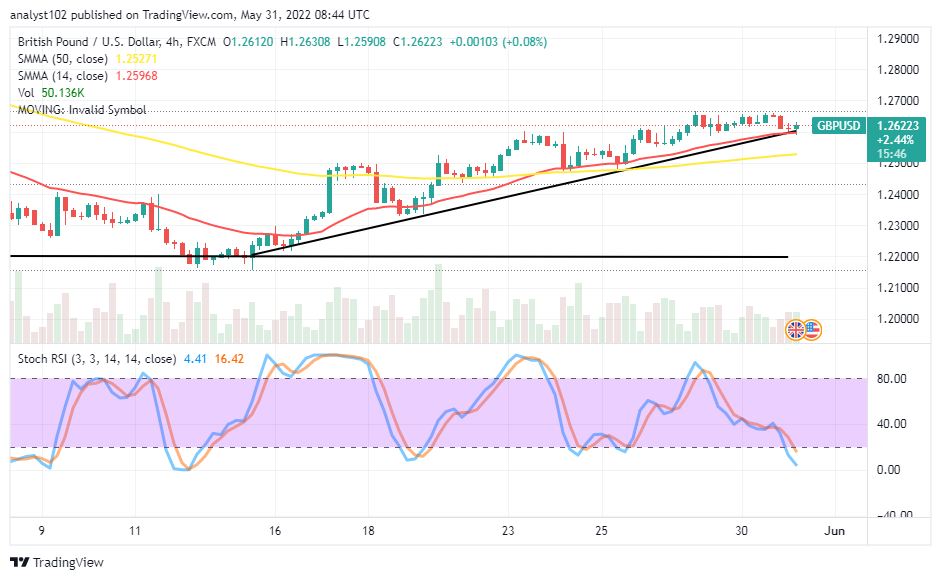
The GBP/USD medium-term chart showcases the pairing currencies market springs upward above the bullish trend line that drew closely below the smaller SMA. Most of the up springs have featured around the buy signal side of the 14-day SMA as the 50-day SMA is underneath it. The Stochastic Oscillators have moved southbound, dipping down into the oversold region to signify price is experiencing a reduction in its pressure to the north. A bullish candlestick is in the making around the 1.2600 value line. A sudden fearful reversal against the move will let in a return of downward-trending motion to resume.
Note: Forexschoolonline.com is not a financial advisor. Do your research before investing your funds in any financial asset or presented product or event. We are not responsible for your investing results.
Learn to Trade Forex Online
GBP/USD Market Springs Upward With a Less Volatility
Footer

ForexSchoolOnline.com helps individual traders learn how to trade the Forex market
WARNING: The content on this site should not be considered investment advice and we are not authorised to provide investment advice. Nothing on this website is an endorsement or recommendation of a particular trading strategy or investment decision. The information on this website is general in nature so you must consider the information in light of your objectives, financial situation and needs.
Investing is speculative. When investing your capital is at risk. This site is not intended for use in jurisdictions in which the trading or investments described are prohibited and should only be used by such persons and in such ways as are legally permitted. Your investment may not qualify for investor protection in your country or state of residence, so please conduct your own due diligence or obtain advice where necessary. This website is free for you to use but we may receive a commission from the companies we feature on this site.
We Introduce people to the world of currency trading. and provide educational content to help them learn how to become profitable traders. we're also a community of traders that support each other on our daily trading journey
Forexschoolonline.com is not a financial advisor. Do your research before investing your funds in any financial asset or presented product or event. We are not responsible for your investing results.

Leave a Reply