GBP/USD Price Prediction – July 12
It showcases that the GBP/USD market operation resumes a downward trending motion at 1.2000 as the pairing coins trade around the 1.1826 value line. The percentage rate pace that the market keeps is at 0.51 negative.
GBP/USD Market
Key Levels:
Resistance levels: 1.2000, 1.2100, 1.2200
Support levels: 1.1700, 1.1600, 1.1500
GBP/USD – Daily Chart
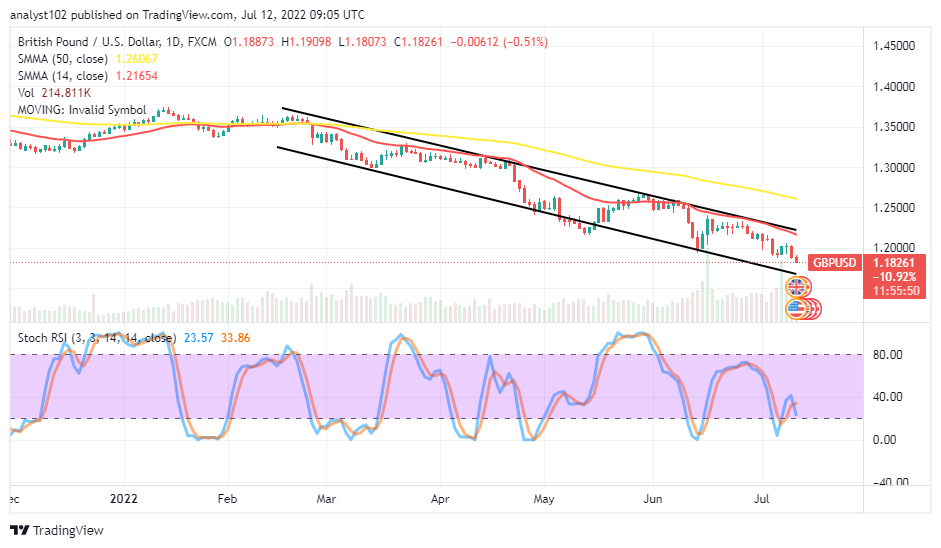
The GBP/USD daily chart reveals the currency pair market operation resumes a downward trending motion at 1.2000. The 14-day SMA indicator is underneath the 50-day SMA indicator. The lower bearish trend line drew southward alongside a smaller SMA. The lower bearish trend line; suggests the price may be declining toward securing a maximal lower point around the 1.1600 level or thereabout. The Stochastic Oscillators have crossed southbound from the range of 40, pointing down closely over the 20 range. What is the dominating trending force direction in the GBP/USD market?
Quite over some time, it is evident that the GBP/USD trade activities have been running within definite bearish channels. And the dominating trending force direction in the pairing currencies tends to be bearish as the price resumes a downward trending motion at 1.2000. Traders who intend to go for a buying order position will have to exercise caution at this time for a while.
On the downside of the technical analysis, the GBP/USD bears have to consolidate their presence in the market underneath the 1.2000 resistance level for a long-term run to gain grand at the expense of bulls’ weaknesses to push against the declining force. A suddenly fearful rebounding move against the value line will amount to letting long-position takers surge in pursuance to reach a resistance around the 1.2165 afterward.
In summary, the GBP/USD market appears to run more depressively underneath the 1.2165 resistance level at a later trading session, down to a lower-trading support level at 1.1600. GBP/USD 4-hour Chart
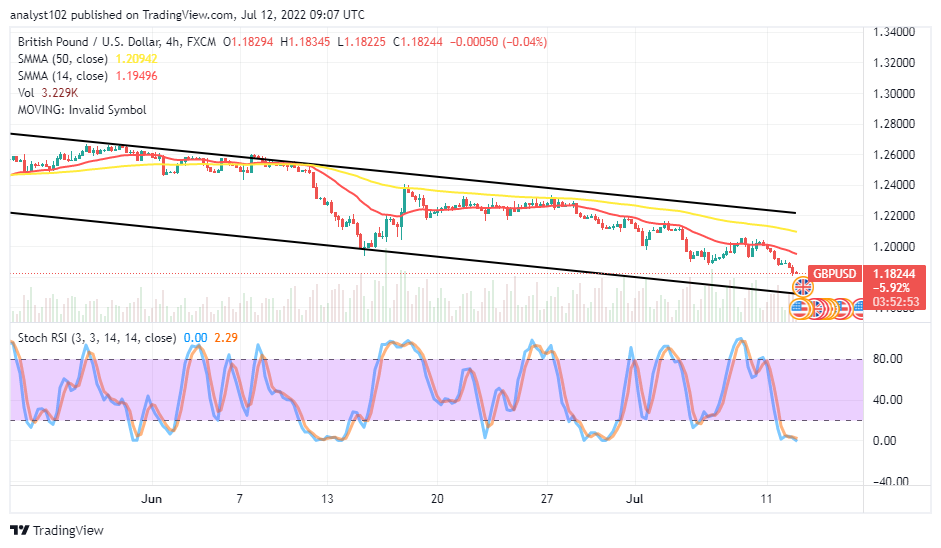
The GBP/USD medium-term chart showcases the currency pair market resumes a downward trending motion at 1.2000 after a long line of rallying motion. The 14-day SMA trend line is underneath the 50-day SMA trend line. The Stochastic Oscillators are in the oversold region. It is that bears will still have a hand over bulls. But, presently, short-position takers should exercise patience toward letting the trade get a new formation pattern, suggesting an overbought reading status after a while.
Note: Forexschoolonline.com is not a financial advisor. Do your research before investing your funds in any financial asset or presented product or event. We are not responsible for your investing results.
Learn to Trade Forex Online
GBP/USD Market Operation Resumes a Downward Trending Motion at 1.2000
Footer

ForexSchoolOnline.com helps individual traders learn how to trade the Forex market
WARNING: The content on this site should not be considered investment advice and we are not authorised to provide investment advice. Nothing on this website is an endorsement or recommendation of a particular trading strategy or investment decision. The information on this website is general in nature so you must consider the information in light of your objectives, financial situation and needs.
Investing is speculative. When investing your capital is at risk. This site is not intended for use in jurisdictions in which the trading or investments described are prohibited and should only be used by such persons and in such ways as are legally permitted. Your investment may not qualify for investor protection in your country or state of residence, so please conduct your own due diligence or obtain advice where necessary. This website is free for you to use but we may receive a commission from the companies we feature on this site.
We Introduce people to the world of currency trading. and provide educational content to help them learn how to become profitable traders. we're also a community of traders that support each other on our daily trading journey
Forexschoolonline.com is not a financial advisor. Do your research before investing your funds in any financial asset or presented product or event. We are not responsible for your investing results.

Leave a Reply