British Pound Price Prediction – October 12
The GBP/USD market operation converges around the trading level of 1.3600. The currency pair now trades at about a 0.08 percentage rate at a market valuation of about 1.3603.
GBP/USD Market
Key Levels:
Resistance levels: 1.3700, 1.3800, 1.3900
Support levels: 1.3500, 1.3400, 1.3300
GBP/USD – Daily Chart
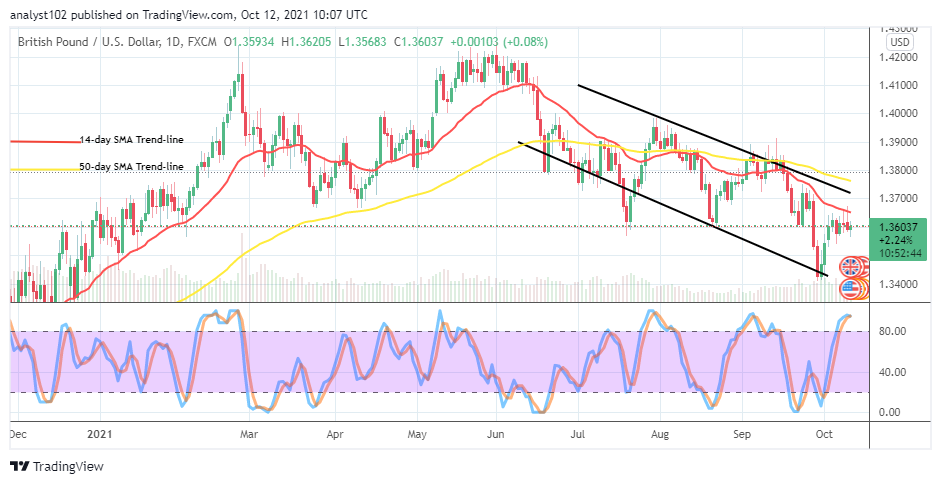
The GBP/USD daily chart reveals that the currency pair market operation converges around the level of 1.3600 closes beneath the smaller SMA trend line. The 50-day SMA indicator is above the 14-day SMA indicator with a smaller space between them. The bearish channel trend lines drew to give a better picture of the trend within which the market moves. The Stochastic Oscillators are in the overbought region with their lines joined together. That signifies that the currency trade will experience a pause for a while at a lower-high trading spot. What could be the GBP/USD price’s next direction as the market operation converges at the 1.3600 level?
Since there has been an indication that the GBP/USD market operation converges at 1.3600 level based on that price recently embarked upon a rallying motion, likely, the US Dollar may still have to undervalue pairing with the Great Britain currency. When that scenario is playing out, bulls will have to be on the lookout for a re-launch in the market.
On the downside, so many price rejection signs have shown up closely underneath the resistance level at 1.3700, giving bears a line of decent sell entries. Active smaller pull-ups closely beneath the point will potentially give back the signal to launch a sell position. Traders are to apply the principles of money management while placing an order.
Summarily, as it observed that the GBP/USD market operation now converges around 1.3600, it is most likely that bears will have a higher advantage. Therefore, traders may still have to be on the lookout for proper sell entries at a lower-high trading spot. GBP/USD 4-hour Chart
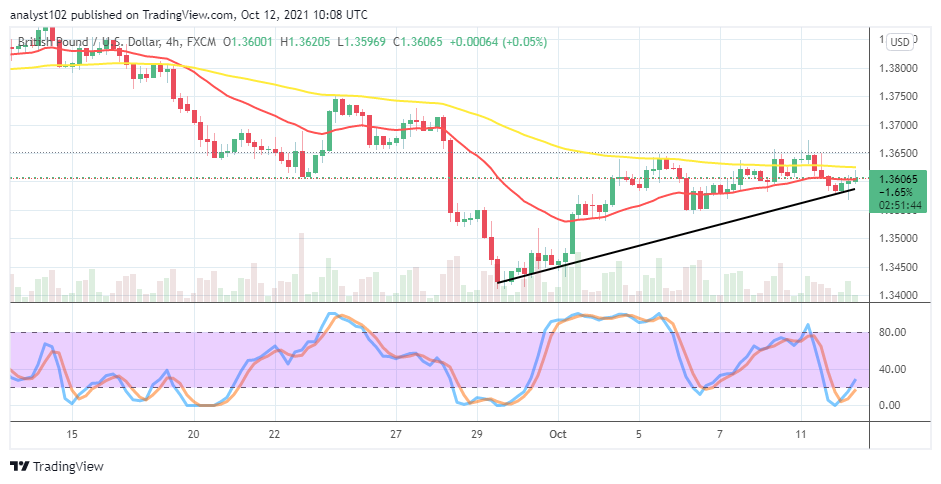
The GBP/USD medium-term chart showcases that the currency pair has embarked upon a recovery motion. However, the formation settings of the SMA trend lines do not back it that the market has firmly found the grand to push northward. The 50-day SMA is over the 14-day SMA. The bullish trend line drew beneath the SMAs to mark the lower point at 1.3450 to a lower-high point closely beneath 1.3600. The Stochastic Oscillators have crossed the lines northbound from the oversold region, briefly past the range of 20. That signifies that the market operation is somewhat experiencing buying pressure. Therefore, short position entry may suspend for a while.
Note: Forexschoolonline.com is not a financial advisor. Do your research before investing your funds in any financial asset or presented product or event. We are not responsible for your investing results.
Learn to Trade Forex Online
GBP/USD Market Operation Converges at 1.3600
Footer

ForexSchoolOnline.com helps individual traders learn how to trade the Forex market
WARNING: The content on this site should not be considered investment advice and we are not authorised to provide investment advice. Nothing on this website is an endorsement or recommendation of a particular trading strategy or investment decision. The information on this website is general in nature so you must consider the information in light of your objectives, financial situation and needs.
Investing is speculative. When investing your capital is at risk. This site is not intended for use in jurisdictions in which the trading or investments described are prohibited and should only be used by such persons and in such ways as are legally permitted. Your investment may not qualify for investor protection in your country or state of residence, so please conduct your own due diligence or obtain advice where necessary. This website is free for you to use but we may receive a commission from the companies we feature on this site.
We Introduce people to the world of currency trading. and provide educational content to help them learn how to become profitable traders. we're also a community of traders that support each other on our daily trading journey
Forexschoolonline.com is not a financial advisor. Do your research before investing your funds in any financial asset or presented product or event. We are not responsible for your investing results.

Leave a Reply