GBP/USD Price Prediction – July 25
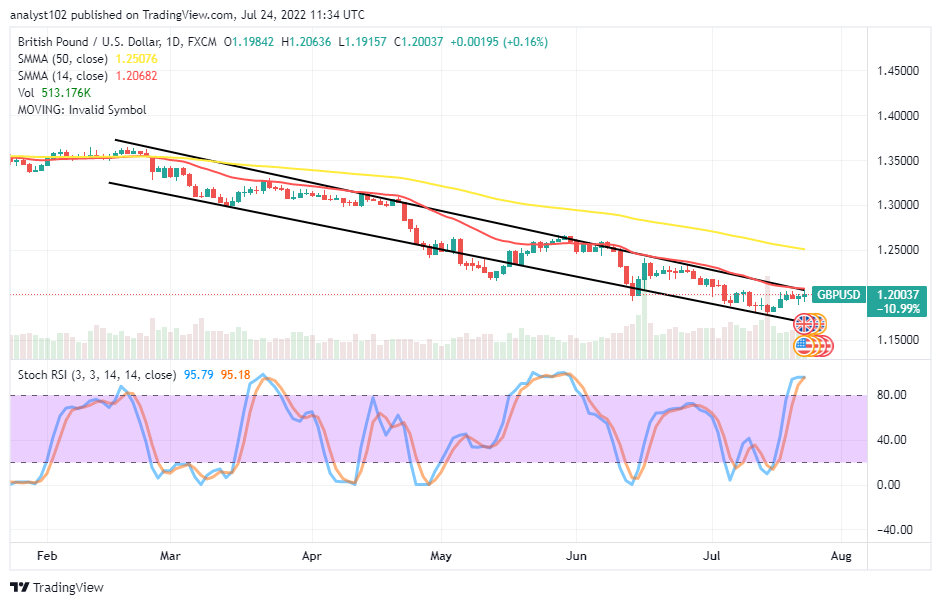
The present trading situation in the GBP/USD trade portends the currency pair market may lose momentum around the 1.2000 level. The last high and low values have been between 1.2063 and 1.1915 at a positive percentage rate of 0.16.
GBP/USD Market
Key Levels:
Resistance levels: 1.2100, 1.2200, 1.2300
Support levels: 1.1900, 1.1800, 1.1700
GBP/USD – Daily Chart
The GBP/USD daily chart reveals the currency pair market may lose momentum at 1.2000. The outlook currently signifies price is trading around the usual path to the downside, having touched resistance at the smaller SMA. The 14-day SMA indicator is underneath the 50-day SMA indicator. And they are both positioned southward. The Stochastic Oscillators are freshly present in the overbought region with their lines closed within. Will the GBP/USD market lose momentum quickly as it trades around 1.2000?
The GBP/USD market may lose momentum at 1.2000. But, it seems not to be forthcoming very quickly in the near time. In the meantime, if bulls would have to consolidate their stances around the value line, the price will push through some higher resistances.
On the downside of the technical analysis, bears have a greater probability to retard against the following pressures between the 1.2000 and 1.2100 points. Stable formation of bearish candlestick around the 14-day SMA indicator, in the long run, will give a clearer signal to the downside motion.
In summary, as there has been an overbought reading situation in the AUD/USD market operations, it is likely to witness a resumption of a declining movement emanating from around the 1.2100 resistance level afterward. GBP/USD 4-hour Chart
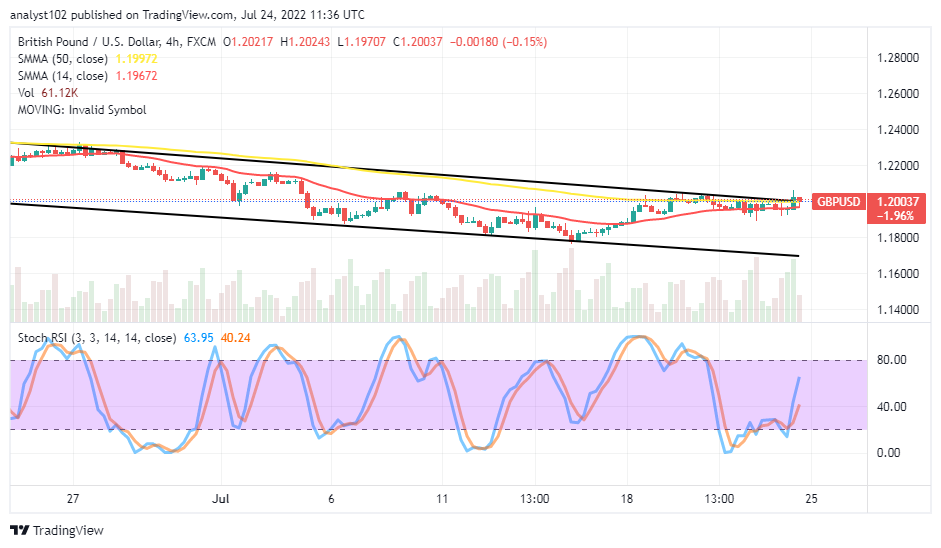
The GBP/USD medium-term chart showcases the currency pair market may lose momentum around 1.2000. The 14-day SMA trend line has moved northward close to the 50-day SMA trend line. And they are closely beneath the value line. The Stochastic Oscillators have somewhat swerved northbound from within the ranges of 20 and 40. At this point, traders should be cautious of false breakouts between the value line and the 1.2100 resistance level. Correction of price movement is to occur around those points afterward.
Note: Forexschoolonline.com is not a financial advisor. Do your research before investing your funds in any financial asset or presented product or event. We are not responsible for your investing results.
Learn to Trade Forex Online
GBP/USD Market May Lose Momentum at 1.2000
Footer

ForexSchoolOnline.com helps individual traders learn how to trade the Forex market
WARNING: The content on this site should not be considered investment advice and we are not authorised to provide investment advice. Nothing on this website is an endorsement or recommendation of a particular trading strategy or investment decision. The information on this website is general in nature so you must consider the information in light of your objectives, financial situation and needs.
Investing is speculative. When investing your capital is at risk. This site is not intended for use in jurisdictions in which the trading or investments described are prohibited and should only be used by such persons and in such ways as are legally permitted. Your investment may not qualify for investor protection in your country or state of residence, so please conduct your own due diligence or obtain advice where necessary. This website is free for you to use but we may receive a commission from the companies we feature on this site.
We Introduce people to the world of currency trading. and provide educational content to help them learn how to become profitable traders. we're also a community of traders that support each other on our daily trading journey
Forexschoolonline.com is not a financial advisor. Do your research before investing your funds in any financial asset or presented product or event. We are not responsible for your investing results.

Leave a Reply