British Pound Price Prediction – December 7
It still somewhat appears that the GBP/USD price valuation has not been able to recover from the recent depressions as the currency pair market hovers around 1.3300 presently. The trade’s percentage rate is estimated at 0.14 positive, trading around 1.3281 line as of writing.
GBP/USD Market
Key Levels:
Resistance levels: 1.3400, 1.3500, 1.3600
Support levels: 1.3200, 1.3100, 1.3000
GBP/USD – Daily Chart
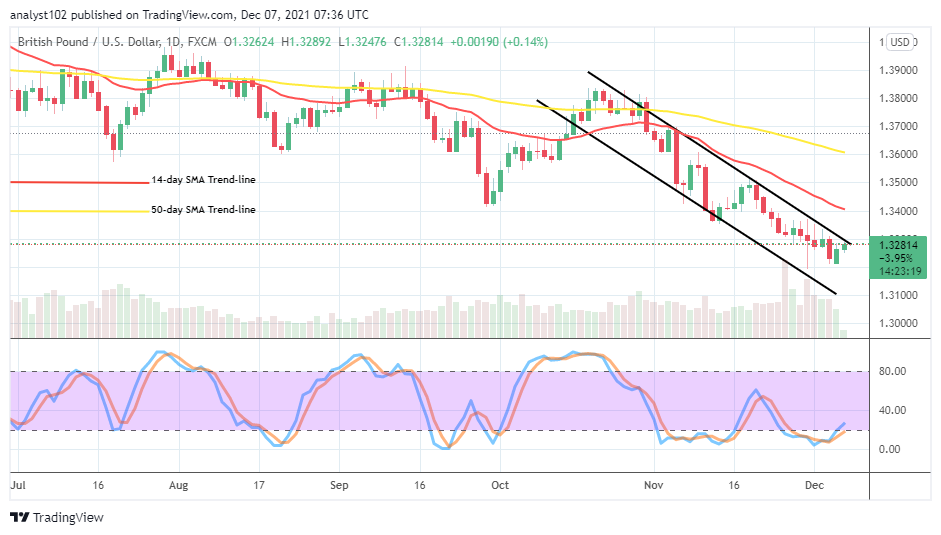
The GBP/USD daily chart reveals that the currency pair market hovers at 1.3300 as 1.3200 seemingly seems to serve as the main-support baseline that price lacks the tendency of breaking down in the near time. The bearish channel trend lines drew to ascertain the southward path that the market still keeps as the trending tool indicators are over them. The 50-day SMA indicator is above the 14-day SMA indicator. The Stochastic Oscillators have crossed the lines northbound from the oversold region, briefly past the range of 20. That raises an indication suggesting a return of an upswing in the market hopefully in the near time. Should the GBP/USD sellers back out at this point as the currency pair market hovers at 1.3300?
The GBP/USD sellers may still have to hold for a while to observe the subsequent price reaction as the currency pair market hovers at 1.3300 presently. The value line appears, stationing alongside the upper bearish channel trend line that symbolizes a resistance trading spot. In the wake of that assumption, buyers needed to exercise some degrees of levity while exerting long orders at that market point.
On the downside of the technical analysis, as the market now hovers around 1.3300, the GBP/USD sellers have to consolidate their efforts to ensure that the price doesn’t fearfully get pushed northward against the upper bearish channel trend-line, achieving a stable uptrend return outlook. Long-holding of position around the value line may lead to more downs against the support line at 1.3200.
Summarily, the GBP/USD market hovering at1.3300 depicts a dilemma trading condition for the two market movers. Therefore, traders should be cautious of their position re-orderings at this point in the currency pair market. GBP/USD 4-hour Chart
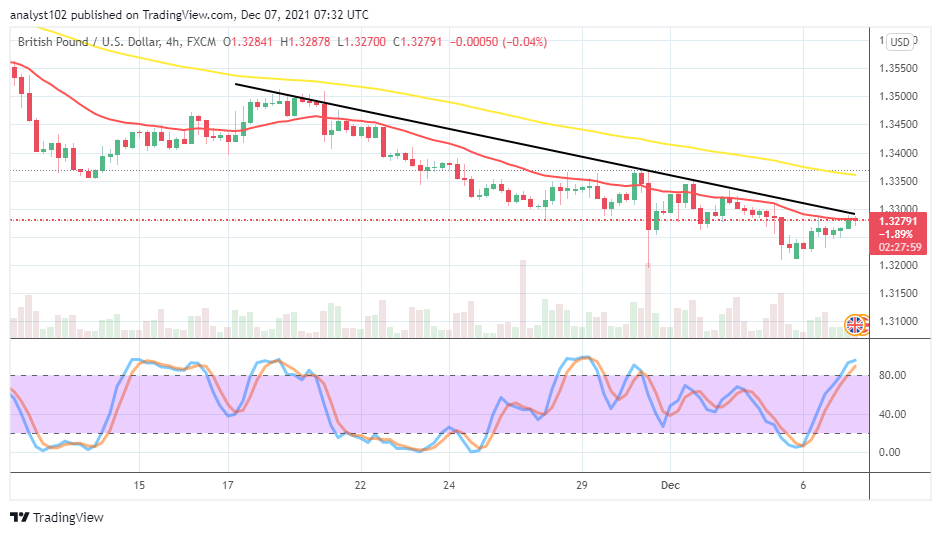
The GBP/USD medium-time chart shows that the forex market hovers at 1.3300. There has been a long-kept variant of bearish candlesticks aligning around the trend line of the smaller SMA to signify a heavy presence of price depressions. The 50-day SMA indicator is above the 14-day SMA indicator. The Stochastic Oscillators have moved into the overbought region to denote the possibility of seeing the base coin market succumbing to another round of depressive motions if the US economy appreciates again at that trading value-line mentioned earlier.
Note: Forexschoolonline.com is not a financial advisor. Do your research before investing your funds in any financial asset or presented product or event. We are not responsible for your investing results.


Leave a Reply