British Pound Price Prediction – December 14
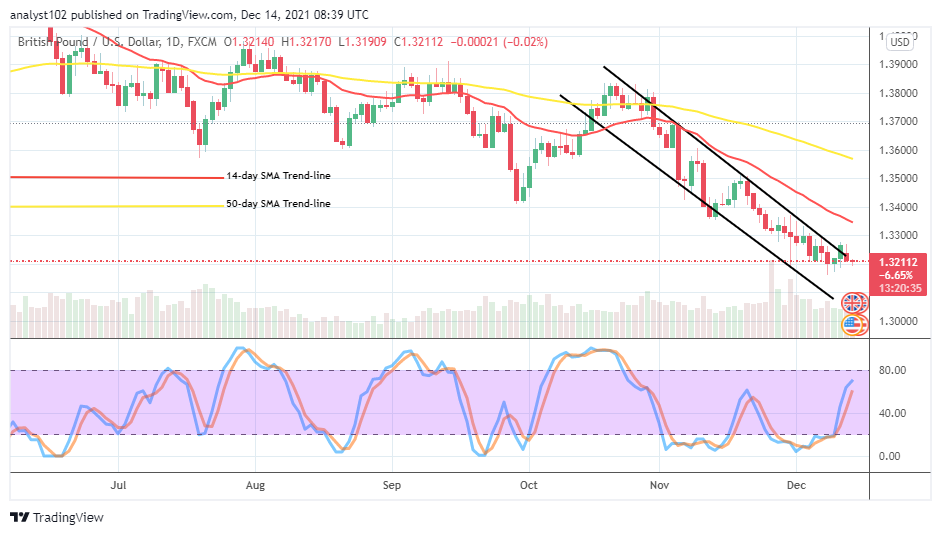
The GBP/USD market holds positions at 1.3200, close to the upper bearish channel. The currency pair price now trades around 1.3211 at a percentage rate of about 0.02 negative.
GBP/USD Market
Key Levels:
Resistance levels: 1.3300, 1.3400, 1.3500
Support levels: 1.3100, 1.3000, 1.2900
GBP/USD – Daily Chart
The GBP/USD daily chart reveals that the currency pair market holds positions at 1.3200, close to the upper bearish channel drawn underneath the trend lines of the SMAs. There is a space separating the indicators as the 14-day SMA is underneath the 50-day SMA. The Stochastic Oscillators are swerving the lines northbound close beneath the range of 80. That signifies that the bearish momentum has not run to an end. Will the GBP/USD trade continue to decline as the currency market holds positions at 1.3200?
Indicators signify that the GBP/USD trade operation will continue to decline for a while as the currency pair market holds positions around 1.3200. It appears that the market may soon start to lose the stance to the downside to re-energize around a lower-trading axis beneath the value line. However, in the process of having the pair pushes up against the upper bearish trend, the resistance at 1.3300 may breach afterward.
On the downside of the technical analysis, the GBP/USD market sellers needed to revert against pressures capable of plugging the currency pair business economy into a full-fledged bullish run. A sudden emergence of fake breakout at 1.3200 will allow sellers to regain market control. In achieving that scenario, traders should back their sell entries with price action.
Summarily, It somewhat still appears that the GBP/USD may go more underselling pressures as the currency pair market holds positions at 1.3200 beneath trend lines of the SMAs under the settings of the long-term run basis. GBP/USD 4-hour Chart
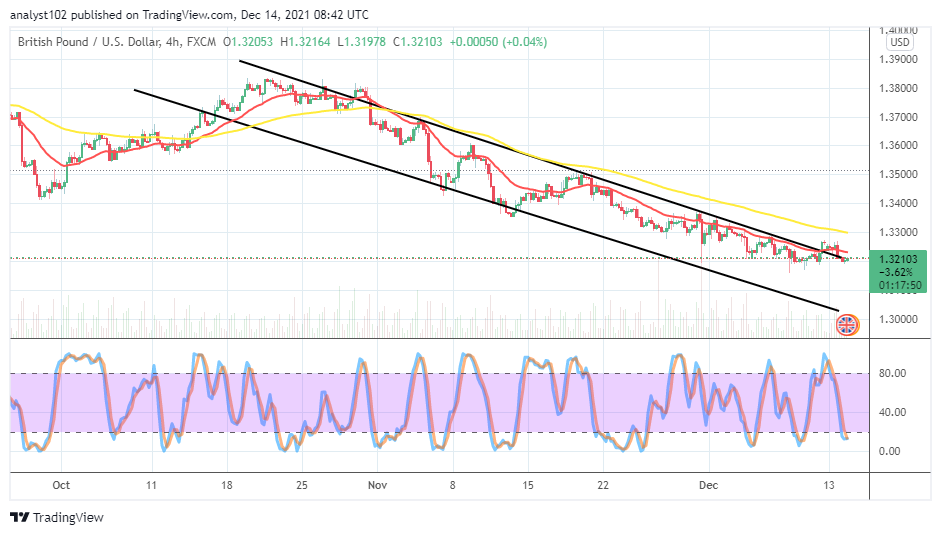
The GBP/USD medium-time chart showcases that the currency pair market holds positions at 1.3200. The 50-day SMA trend line is above the 14-day SMA trend line. The bearish channels drew as the upper trend line aligned closely alongside the smaller SMA indicator. The Stochastic Oscillators have slightly dipped past the range of 20 into the oversold region. That suggests the possibility that the market is due for making upswings. But, a return force against any active upswing may lead to the bearish-trending outlook continuation.
Note: Forexschoolonline.com is not a financial advisor. Do your research before investing your funds in any financial asset or presented product or event. We are not responsible for your investing results.
Learn to Trade Forex Online
GBP/USD Market Holds Positions at 1.3200
Footer

ForexSchoolOnline.com helps individual traders learn how to trade the Forex market
WARNING: The content on this site should not be considered investment advice and we are not authorised to provide investment advice. Nothing on this website is an endorsement or recommendation of a particular trading strategy or investment decision. The information on this website is general in nature so you must consider the information in light of your objectives, financial situation and needs.
Investing is speculative. When investing your capital is at risk. This site is not intended for use in jurisdictions in which the trading or investments described are prohibited and should only be used by such persons and in such ways as are legally permitted. Your investment may not qualify for investor protection in your country or state of residence, so please conduct your own due diligence or obtain advice where necessary. This website is free for you to use but we may receive a commission from the companies we feature on this site.
We Introduce people to the world of currency trading. and provide educational content to help them learn how to become profitable traders. we're also a community of traders that support each other on our daily trading journey
Forexschoolonline.com is not a financial advisor. Do your research before investing your funds in any financial asset or presented product or event. We are not responsible for your investing results.

Leave a Reply