GBP/USD Price Prediction – October 25
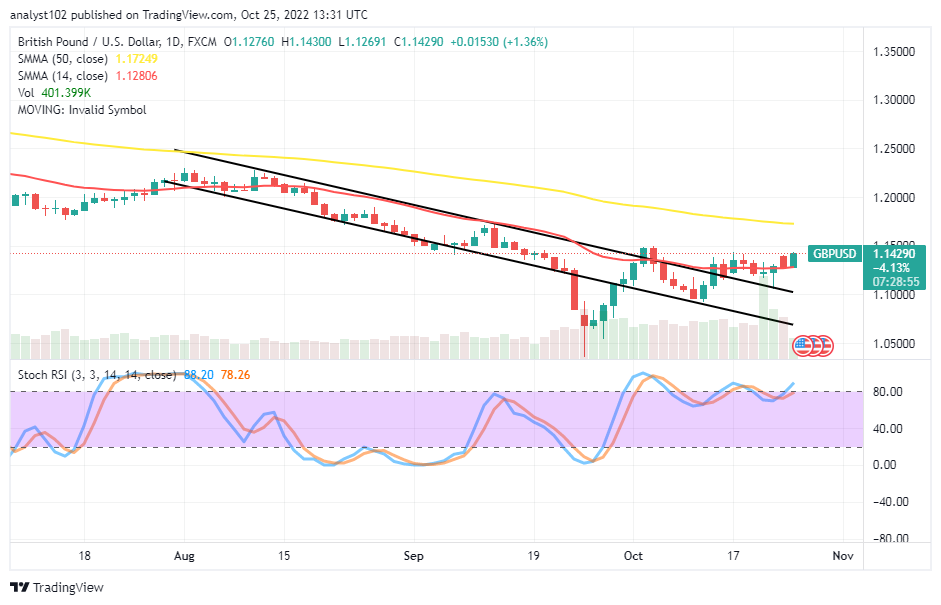
The depth of a downward-trending impact in the GBP/USD trade operations has refused to resume falling more dipper as the currency pair market firmly holds recovery motions closely to the line of 1.1500 over time. The high and the low-value lines produced in the last trading hours of today’s session are between 1.14300 and 1.1269, keeping a 1.36% positive.
GBP/USD Market
Key Levels:
Resistance levels: 1.1600, 1.1700, 1.1800
Support levels: 1.1200, 1.1100, 1.1000
GBP/USD – Daily Chart
The GBP/USD daily chart showcases the currency pair market firmly holds recovery motions around the trend line of the smaller SMA. The 50-day SMA indicator is at 1.17249, above the 1.12806 value point of the 14-day SMA indicator. The Stochastic Oscillators have been swinging eastwardly around the range of 80, and the overbought region to indicate a level of an indecision trading trait also plays out to some extent. Will the GBP/USD market’s operation hinge on the 1.1500 level?
From the technical point of view, the GBP/USD market’s operations tend to hinge on the 1.1500 level as the pairing coin market firmly holds recovery motions around the value line. Buyers should intensify efforts to ensure price breaks out the point forcibly with a devoid of reversal move to establish sustainable ups.
On the downside of the technical analysis, on October 5th trading session when the GBP/USD 1.1500 market level witnessed a drawdown while the price could not surge past it. A full-fledged push for a test of resistance around the value line again with the intensity of coupling it with a retracement may be a reproduction of bears taking over the market control, as previously around the zone.
In summary, despite the GBP/USD market firmly holding in recovery motions, the 50-day SMA trend line stays over the current trading zone, portends the activities are still under a bearish setting. Sellers only need to look out for a pattern suggesting a merely sustainable up before launching a shorting order afterward. GBP/USD 4-hour Chart
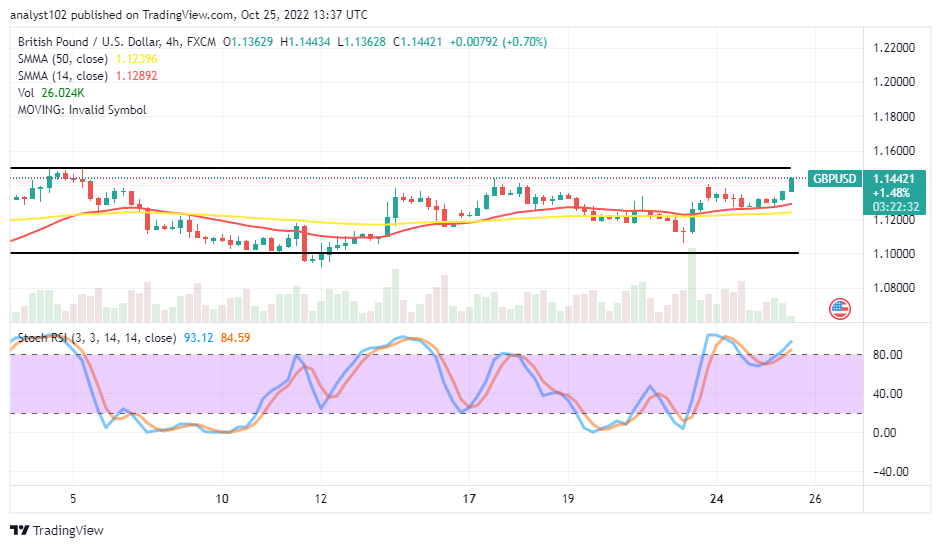
The GBP/USD medium-term chart reveals the currency pair market firmly holds recovery motions in wide range-bound spots. The upper horizontal line drew at 1.1500, and the lower horizontal line drew at 1.1000. The 14-day SMA indicator is at 1.12892, over the 1.12396 value line of the 50-day SMA indicator. The Stochastic Oscillators have moved into the overbought region, pointing toward the northbound at 84.59 and 93.12 range values. A bullish candlestick is in the making to indicate a buying momentum is ongoing, possibly to a peak zone. The emergence of a bearish candlestick will give a signal to get a selling order.
Note: Forexschoolonline.com is not a financial advisor. Do your research before investing your funds in any financial asset or presented product or event. We are not responsible for your investing results.
Learn to Trade Forex Online
GBP/USD Market Firmly Holds Recovery Motions
Footer

ForexSchoolOnline.com helps individual traders learn how to trade the Forex market
WARNING: The content on this site should not be considered investment advice and we are not authorised to provide investment advice. Nothing on this website is an endorsement or recommendation of a particular trading strategy or investment decision. The information on this website is general in nature so you must consider the information in light of your objectives, financial situation and needs.
Investing is speculative. When investing your capital is at risk. This site is not intended for use in jurisdictions in which the trading or investments described are prohibited and should only be used by such persons and in such ways as are legally permitted. Your investment may not qualify for investor protection in your country or state of residence, so please conduct your own due diligence or obtain advice where necessary. This website is free for you to use but we may receive a commission from the companies we feature on this site.
We Introduce people to the world of currency trading. and provide educational content to help them learn how to become profitable traders. we're also a community of traders that support each other on our daily trading journey
Forexschoolonline.com is not a financial advisor. Do your research before investing your funds in any financial asset or presented product or event. We are not responsible for your investing results.

Leave a Reply