GBP/USD Price Prediction – February 15
There have been several attempts to move northward further in the GBP/USD price operations as the currency pair market finds pushing above 1.3600 difficult. Price opens at 1.3523 but loses about 48 pips between the high and low of 1.3566 and 1.3518 as it trades at 1.3541. The percentage rate of the currency pair market is at 0.13.
GBP/USD Market
Key Levels:
Resistance levels: 1.3600, 1.3700, 1.3800
Support levels: 1.3400, 1.3300, 1.3200
GBP/USD – Daily Chart
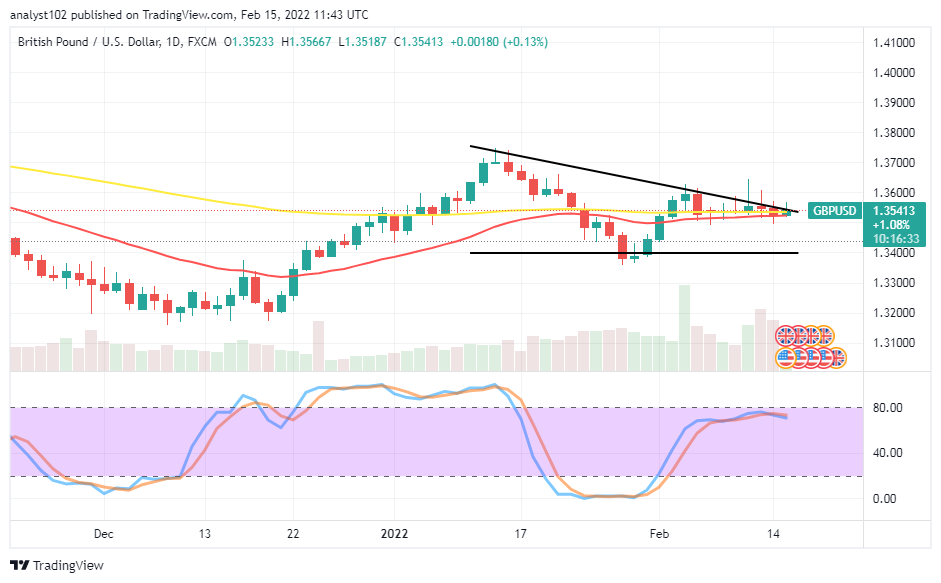
The GBP/USD daily chart reveals the currency pair market finds pushing above 1.3600 difficult. The 14-day SMA indicator is closely underneath the 50-day SMA indicator. And they are not too far over the 1.3500 level. The bearish trend line drew above them, indicating the possibility of price responding more positively at a higher point to a downing process. The Stochastic Oscillators have conjoined closely beneath the range of range 80. And with the emergence of variant top shadow candlesticks, the smooth movements to the upside appear dicey. Does the current GBP/USD trade outlook suggest getting more upsurges as the currency pair market finds pushing above 1.3600 difficult?
If the GBP/USD price embarks upon moving in a consolidation style above the 1.3500, there will be a line of relatively ups as the currency pair market finds pushing above 1.3600 difficult. A loss of momentum around the 1.3500 level will see the price breaking through some barrier supports to revisit a previous low at 1.3400.
On the downside of the technical analysis, the GBP/USD market short-position takers would now have to stay alert to spot a strong reversal of upward motions around the 1.3600 resistance trading spot to launch a sell order by not over-leveraging their positions as well. Expectantly, some selling opportunities may occur between the value-line and a higher resistance trading level at 1.3700 afterward.
Summarily, the trading outlooks in the GBP/USD market operations suggest the potential of seeing more downs than ups in the subsequent activities. But, traders will have to be cautious of exerting a sell order especially, while there is no power motion to back such entry. GBP/USD 4-hour Chart
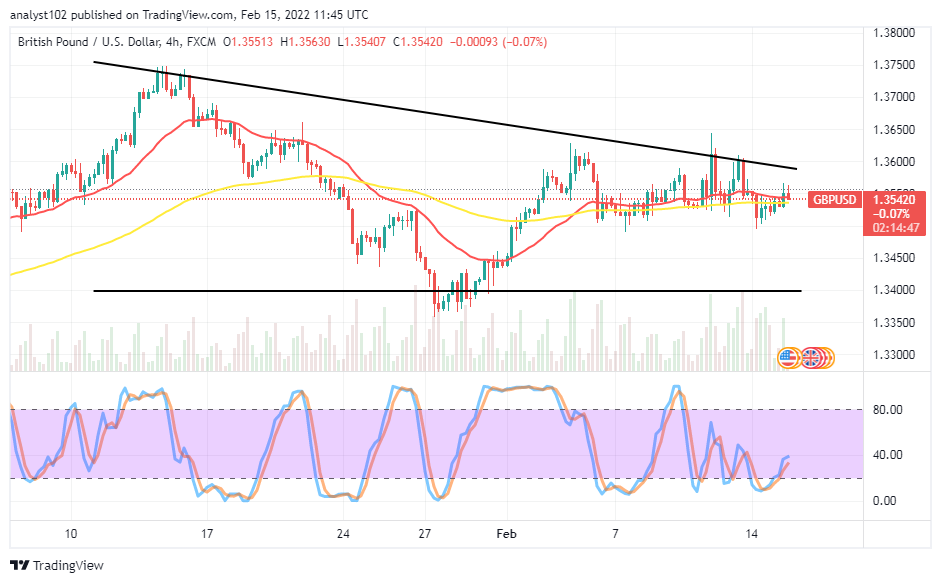
The GBP/USD 4-hour chart showcases the currency pair market finds pushing above the 1.3600 resistance level difficult. Some attempts have taken place but to no avail. The 14-day SMA trading indicator is tightly above the 50-day SMA trading indicator closely below 1.3550. The bearish trend line drew above them, confirming the validity of the value-line mentioned earlier. The Stochastic Oscillators have been making their motions re-occurring between the ranges of 40 and zero, signifying the possibilities of getting more lows than ups in the present trading conditions.
Note:Forexschoolonline.com is not a financial advisor. Do your research before investing your funds in any financial asset or presented product or event. We are not responsible for your investing results.


Leave a Reply