GBP/USD Price Prediction – March 1
A significant reduction has taken place during the last couple of trading days’ sessions in the GBP/USD price valuation as the currency pair market dumps, embarking on a recovery motion. The trading operation commences with a balance of 1.3414 to now trade between the high of 1.3437 and a low of 1.3386.
GBP/USD Market
Key Levels:
Resistance levels: 1.3500, 1.3600, 1.3700
Support levels: 1.3300, 1.3200, 1.3100
GBP/USD – Daily Chart
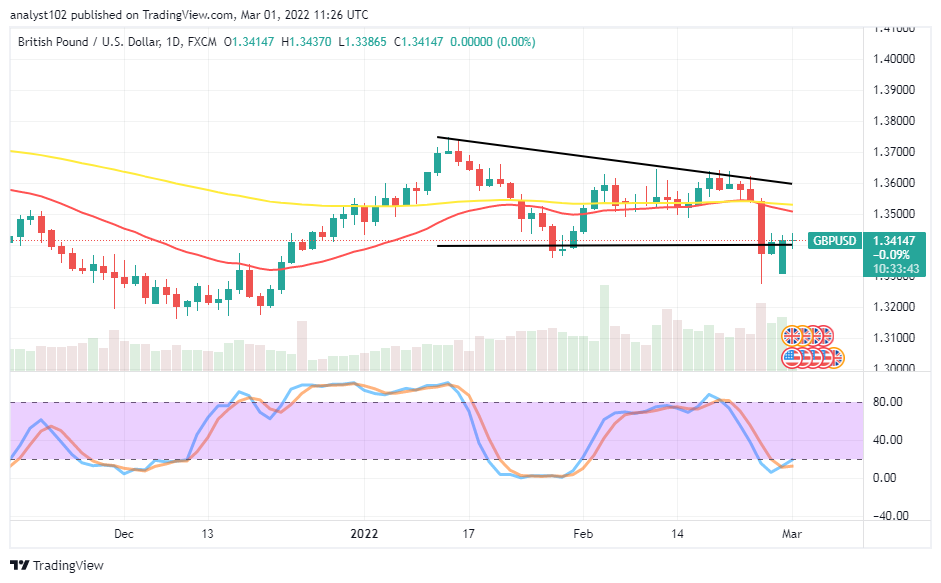
The GBP/USD daily chart showcases the currency pair market dumps, embarking on a recovery motion. Price broke the horizontal line drawn at 1.3400 before a bullish candlestick around the 1.3300 support level. The 14-day SMA indicator has intercepted the 50-day SMA indicator to the downside, signifying an affirmation of resistance zone awaiting the current recovery motion. Stochastic Oscillators are attempting to cross northbound in the oversold region. Will the GBP/USD trade drop further as there has been a situation showcasing that the currency pair market dumps, trying to embark on a recovery motion?
In the long-term running outlook of the GBP/USD, it seems there will be a steady elongation recovery movement in the trade operations. There has been a bullish candlestick formed during the February 28th trading time. from 1the 1.3300l, bulls will have to continue to build alongside the buying wall.
On the downside of the technical analysis, it would be technically sound well that price is allowed to beef up in strength up to a higher trading level around 1.3500 to observe the possibility of a downward movement returning before considering a launch of the sell order.
In summary, the market movers have to be wary of taking positions by adhering to the direction of price action. A sign of rejection seems to pile up around 1.3400, denoting that a pause is playing for now. A sudden pull-up at that value line will nudge the market into getting more ups. GBP/USD 4-hour Chart
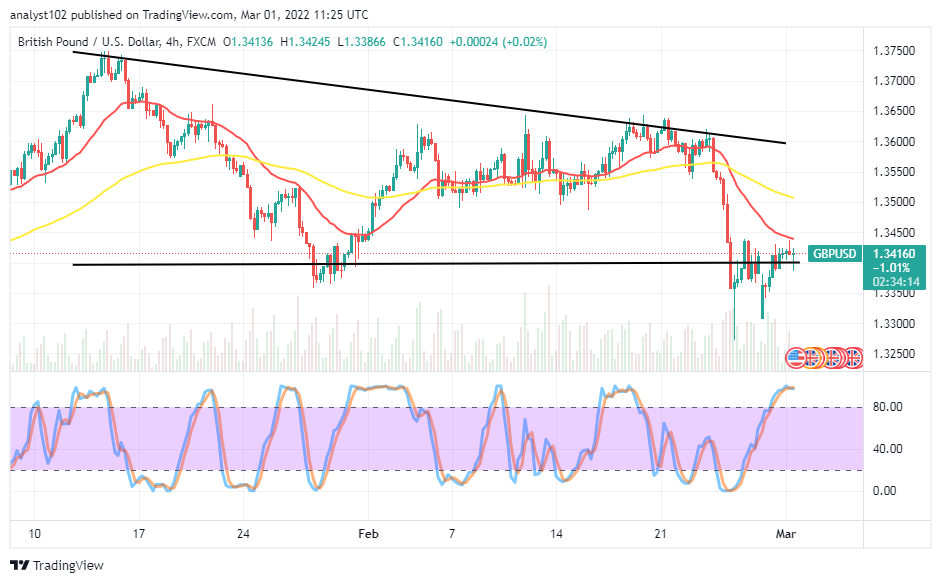
The GBP/USD medium-term chart shows the currency pair dumps, embarking on a recovery motion. The 50-day SMA indicator is above the 14-day SMA indicator. The bearish trend line drew above the SMAs to signify that the trading activities between the duos currencies are yet under a selling setting. The Stochastic Oscillators are in the overbought region. The point at 1.3450 appears to be the main resistance level against the continuation in the current recovery motion. A long-hold of positions around the value line may lead the Stochastic Oscillators into lowering their lines. Afterward, a sudden breakout at the point mentioned earlier will potentially propel the price to a high of 1.3500 or 1.3550.
Note:Forexschoolonline.com is not a financial advisor. Do your research before investing your funds in any financial asset or presented product or event. We are not responsible for your investing results.


Leave a Reply