GBP/USD Price Prediction – August 29
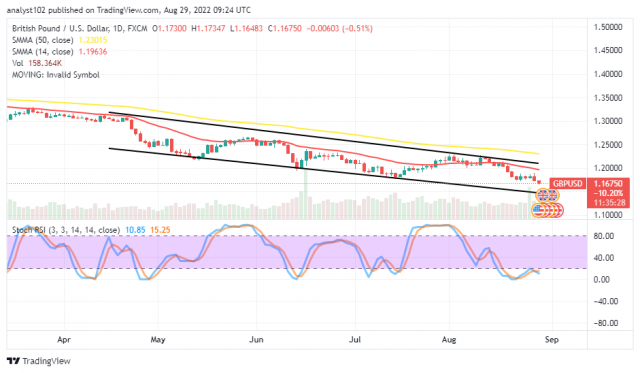
From the technical long-term trading outlook, the GBP/USD market activity draws southward as it trades between 1.17347 and 1.16483 value lines since the commencement of the session into today’s operation. Price maintains a minute percentage rate of 0.51.
GBP/USD Market
Key Levels:
Resistance levels: 1.1800, 1.1900, 1.2000
Support levels: 1.1500, 1.1400, 1.1300
The GBP/USD daily chart showcases the currency pair market draws southward underneath the trend lines of the SMAs to eye a lower-trading zone around the lower bearish channel trend line drawn. The bearish trend line drew downward to touch a support zone around the 1.1500 value, denoting that price can rebound after a while. Given a layer of resistance by the trading indicators, the 14-day SMA is at 1.19636 underneath the 1.23015 value line of the 50-day SMA. The stochastic Oscillators keep 15.25 and 10.85 range values in the oversold region.
Has there a negating signal against getting more lows in the GBP/USD market operation now?
A tangible negating signal against getting more lows has not surfaced presently in the GBP/USD market operation as the currency pair market draws southward through some support levels. Bulls tend to regain trade control while the downward force has reached a completion stage around the lower bearish trend line drawn afterward. Therefore, buyers need to exercise caution for a while more.
On the downside of the technical analytics write-up, the GBP/USD market bears, and the motion to the downside has been gradual. Active movements in a consolidation manner southward to the support level at 1.1500 may be the highest low point the market intends to reach before giving way back to high swings.
In summary, at this moment, short-position placers need to exercise caution while trying to ride on the current downward-trending force to the end despite there has not been a signal militating against it.
GBP/USD 4-hour Chart
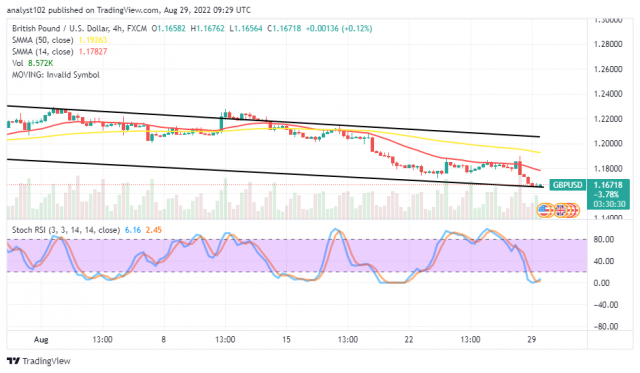
The GBP/USD medium-term chart showcases the currency pair market draws southward, trying to rebuild support around the trend line of the lower bearish channel. The 14-day SMA indicator is at 1.17827 beneath the 1.19263 value line of the 50-day SMA indicator. And they are in the bearish channels drawn. The Stochastic Oscillators have traveled southbound into the oversold region, placing at 6.16 and 2.45 range values. That portends buyers may soon be building a stance to make upswings afterward. A bullish candlestick has to emerge at a lower-trading zone before going for a buying order.
Note: Forexschoolonline.com is not a financial advisor. Do your research before investing your funds in any financial asset or presented product or event. We are not responsible for your investing results.


Leave a Reply