GBP/USD Price Prediction – June 14
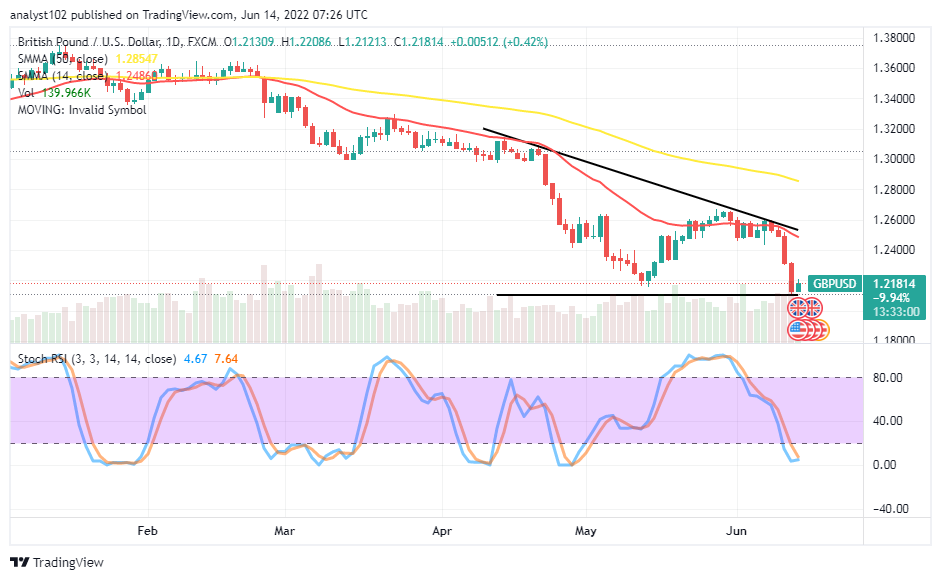
There has been a huge-bearish impact on the GBP/USD trade operations as the currency market declines significantly, finding support around the 1.2100 line. The pairing coin’s value opened around 1.2130 to drop to a lower of 1.2121 before slightly swinging back upward to trade at 1.2181, keeping a 0.42% positive.
GBP/USD Market
Key Levels:
Resistance levels: 1.2300, 1.2400, 1.2500
Support levels: 1.2100, 1.2000, 1.1900
GBP/USD – Daily Chart
The GBP/USD daily chart showcases the currency pair market declines significantly to find support around the 1.2100 level, far below the trend lines of the SMAs. The 14-day SMA indicator is underneath the 50-day SMA indicator. The horizontal line drew at the value line, expectantly to serve as the support baseline for the price to begin to get upswings. The Stochastic Oscillators are in the oversold region near the zero range, attempting to close the lines. Will the GBP/USD market decline furthermore beyond the 1.2100 support level?
The probability of the GBP/USD market operations declining sustainably beyond the 1.2100 support level is dicey currently at this trading capacity moment. An eventual emergence of a bullish candlestick around the value support baseline may technically create a buying wall for the following upward motions.
On the downside of the technical analysis, the GBP/USD market bears have to keep their stances around the selling wall of the bearish candlestick that occurred during yesterday’s operations. The main resistances are between the 1.2400 and the 1.2500 value lines. Therefore, it would be an ideal technical approach that traders wait to spot if there’ll be a reversal of price movement in or around those points before considering launching a sell order.
In summary, the GBP/USD market operations are expected not to decline beyond the 1.2100 support level. Even while that occurs, long-position takers have to be alert to get a rebound to leverage their entries. GBP/USD 4-hour Chart
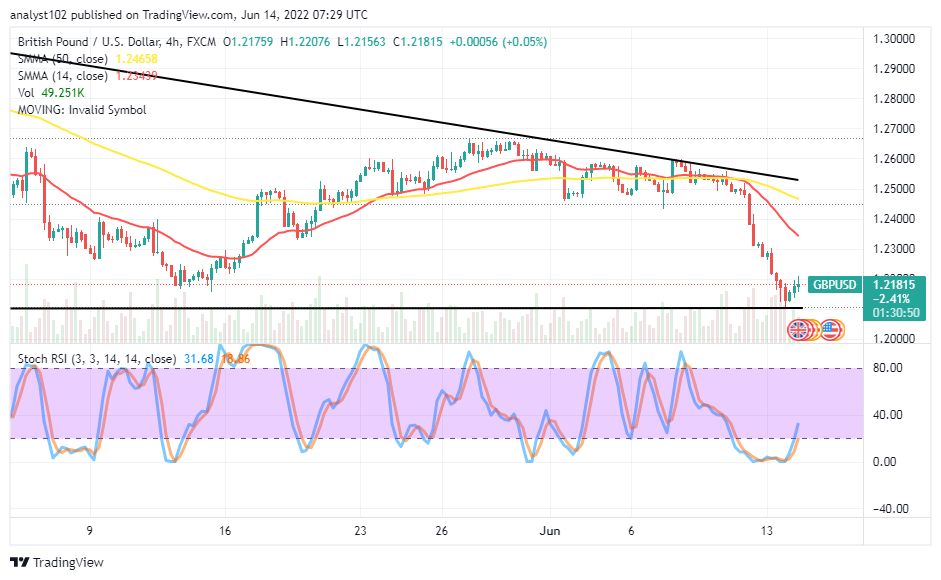
The GBP/USD medium-term chart showcases the currency pair market declines significantly, trying to find support around the 1.2100 level. The 14-day SMA indicator has detached from a conjoint trading area with the 50-day SMA trend line to cross southward, indicating that a downward motion is ongoing. The Stochastic Oscillators have managed to cross northbound from the oversold region, slightly against the 20 range. That portends some upward forces gathering around the value line to materialize with fearfulness in the near time.
Note: Forexschoolonline.com is not a financial advisor. Do your research before investing your funds in any financial asset or presented product or event. We are not responsible for your investing results.
Learn to Trade Forex Online
GBP/USD Market Declines Significantly, Finding Support
Footer

ForexSchoolOnline.com helps individual traders learn how to trade the Forex market
WARNING: The content on this site should not be considered investment advice and we are not authorised to provide investment advice. Nothing on this website is an endorsement or recommendation of a particular trading strategy or investment decision. The information on this website is general in nature so you must consider the information in light of your objectives, financial situation and needs.
Investing is speculative. When investing your capital is at risk. This site is not intended for use in jurisdictions in which the trading or investments described are prohibited and should only be used by such persons and in such ways as are legally permitted. Your investment may not qualify for investor protection in your country or state of residence, so please conduct your own due diligence or obtain advice where necessary. This website is free for you to use but we may receive a commission from the companies we feature on this site.
We Introduce people to the world of currency trading. and provide educational content to help them learn how to become profitable traders. we're also a community of traders that support each other on our daily trading journey
Forexschoolonline.com is not a financial advisor. Do your research before investing your funds in any financial asset or presented product or event. We are not responsible for your investing results.

Leave a Reply