GBP/USD Price Prediction – February 8
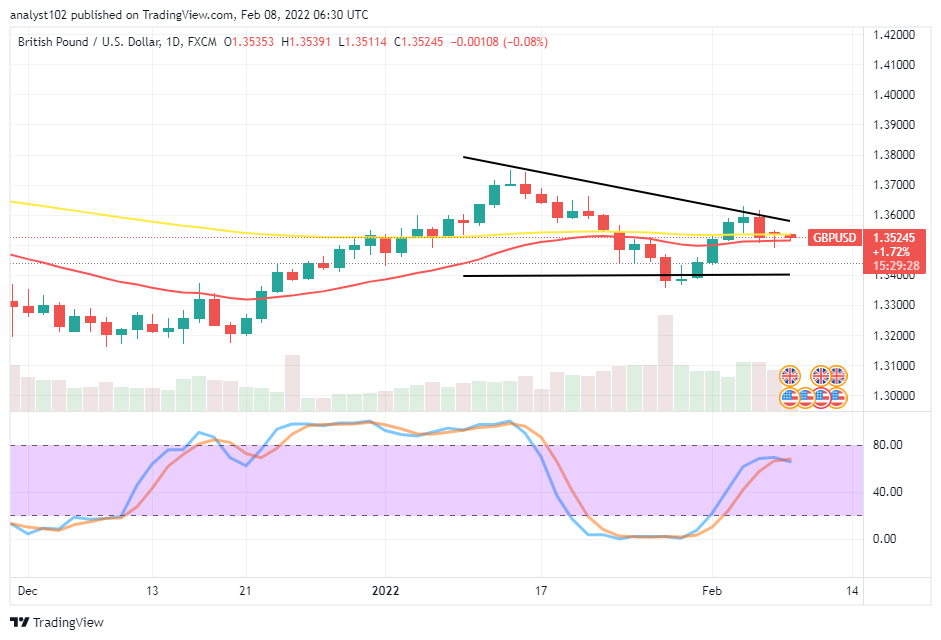
The GBP/USD market declines, hitting resistance at 1.3600 as the currency pair price opens around 1.3535, trading between the high and low of 1.3539 and 1.3511. The trade’s percentage rate is at 0.08 negative.
GBP/USD Market
Key Levels:
Resistance levels: 1.3600, 1.3700, 1.3800
Support levels: 1.3400, 1.3300, 1.3200
GBP/USD – Daily Chart
The GBP/USD daily chart exhibits the currency pair market declines, hitting resistance around 1.3600. The declining force took effect during the February 4th trading course. The bearish trend line drew above the SMAs and, the horizontal line drawn beneath them formed the descending triangle. The 14-day SMA indicator is closely located underneath the 50-day SMA indicator, pointing toward the east direction within the triangular pattern. The Stochastic Oscillators have faintly crossed their lines southbound near underneath the range of 80. That indicates the possibility of seeing a return of downward moves in the near time. Will the GBP/USD price surrender out rightly in the near time as the currency pair market declines, hitting resistance at 1.3600?
As it has once again observed that the GBP/USD price pattern has formed a descending triangular shape, the currency pair to witness more downs as the market declines, hitting resistance at 1.3600 in about a couple of days back. If buyers summon energy around the 1.3500, the price will push northward back to breach the bearish trend line to invalidate the potentiality of seeing a downward trend continuing afterward.
On the downside of the technical analysis, the GBP/USD market short-position takers have to now consolidate their appearances by holding stances firmer underneath the 1.36000 resistance trading level. A sudden breakout at the market value-line mentioned may put shorting positions on suspension for some time.
Summarily, it currently appears that the GBP/USD market operation will experience more downs in the subsequent operations provided that the price doesn’t spike abruptly against the bearish trend line at the 1.3600 resistance level afterward. GBP/USD 4-hour Chart
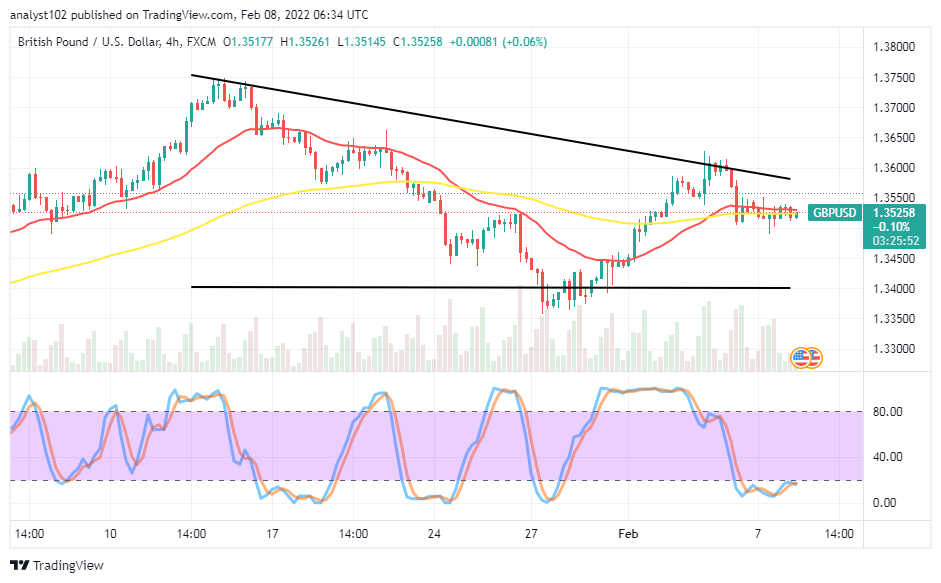
The GBP/USD 4-hour chart reveals the currency pair market declines, hitting resistance at 1.36000. The 14-day SMA indicator is closely above the 50-day SMA indicator. Variant candlesticks have featured in lower lows outlook against the SMAs within 1.3550 and 1.3500 levels. The Stochastic Oscillators are in the oversold region, consolidating within it to indicate the market may still drive lovers if the current situation doesn’t turn out to let in a bullish candlestick emergence against the second higher trading level mentioned earlier.
Note:Forexschoolonline.com is not a financial advisor. Do your research before investing your funds in any financial asset or presented product or event. We are not responsible for your investing results.
Learn to Trade Forex Online
GBP/USD Market Declines, Hitting a Resistance at 1.3600
Footer

ForexSchoolOnline.com helps individual traders learn how to trade the Forex market
WARNING: The content on this site should not be considered investment advice and we are not authorised to provide investment advice. Nothing on this website is an endorsement or recommendation of a particular trading strategy or investment decision. The information on this website is general in nature so you must consider the information in light of your objectives, financial situation and needs.
Investing is speculative. When investing your capital is at risk. This site is not intended for use in jurisdictions in which the trading or investments described are prohibited and should only be used by such persons and in such ways as are legally permitted. Your investment may not qualify for investor protection in your country or state of residence, so please conduct your own due diligence or obtain advice where necessary. This website is free for you to use but we may receive a commission from the companies we feature on this site.
We Introduce people to the world of currency trading. and provide educational content to help them learn how to become profitable traders. we're also a community of traders that support each other on our daily trading journey
Forexschoolonline.com is not a financial advisor. Do your research before investing your funds in any financial asset or presented product or event. We are not responsible for your investing results.

Leave a Reply