GBP/USD Price Prediction – October 11
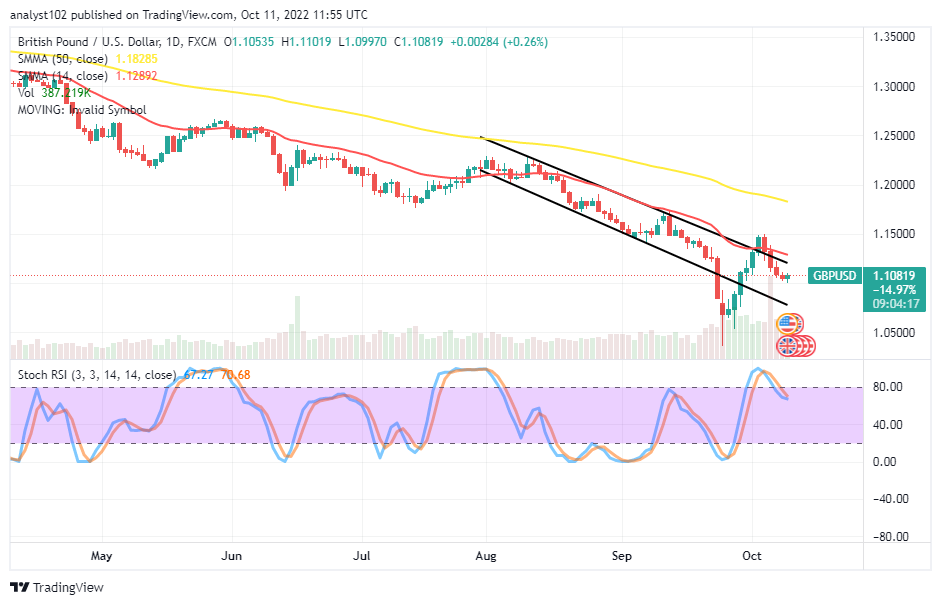
The trading outlook of the GBP/USD market operations portends that the price could remain strong during a correction mode since it hit resistance at 1.1500 some days ago. The price has reached a high of 1.11019 and a low of 1.09970 with an opening balance of 1.10535.
GBP/USD Market
Key Levels:
Resistance levels: 1.1200, 1.1300, 1.1400
Support levels: 1.0900, 1.0800, 1.0700
GBP/USD – Daily Chart
The GBP/USD daily chart reveals the pairing currency price could remain strong during a correction manner beneath the SMA trend lines. The upper bearish trend line is around the 14-day SMA indicator, which is at 1.12892, underneath the 1.18285 value line of the 50-day SMA indicator. The Stochastic Oscillators have crossed southbound to the range values of 70.68 and 67.27 from the overbought region. Will the GBP/USD market fall below the 14-day SMA trend point in a continuation mode?
There is every likelihood that the GBP/USD market will decline below the trend line of the 14-day SMA in a continuity manner as established that the market could remain strong during a correction. At this point, buyers have to be cautious of new buying orders. Therefore, bulls may need to go by the reading of the Stochastic Oscillators while they go lower to the downside before reconsidering making a comeback.
On the downside of the technical analysis, sellers need the price to make a false spike toward the 14-day SMA trend line, coupling with an active reversal to allow a sell-entry order. In the wake of intensifying a further declining motion, the price tends to sell off to find support around 1.0800 afterward, especially if the Stochastic Oscillators’ reading suggests the market trading capacity has dropped to a significantly lower range value.
In summary, as it is, the GBP/USD trade activities stand in a posture of giving in much to the downward-trending directions. Therefore, bears are to look out for a high-resistance trading pattern to launch a sell order. GBP/USD 4-hour Chart
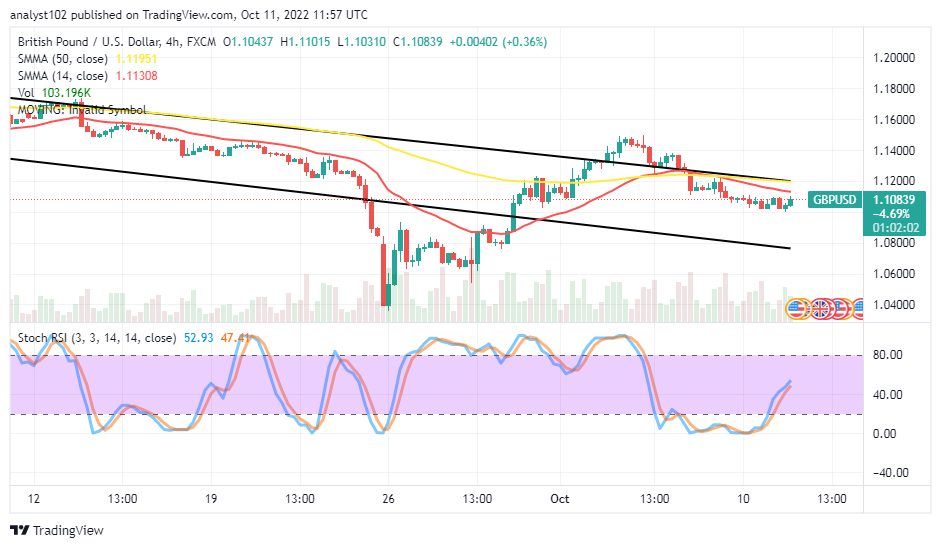
The GBP/USD medium-term chart depicts the currency pair market could remain strong during a correction. The 14-day SMA is at a 1.11308 value point, beneath the 1.11951 of the 50-day SMA indicator. The bearish channel trend lines drew to ascertain the trending outlook pace the market has been pushing around the SMAs. The stochastic oscillators have moved from the oversold area to the range values between 47.41 and 52.93. That suggests that before starting to fall again, the market may temporarily rise to test resistance near the 1.1200 barrier level.
Note: Forexschoolonline.com is not a financial advisor. Do your research before investing your funds in any financial asset or presented product or event. We are not responsible for your investing results.


Leave a Reply