GBP/USD Price Prediction – March 15
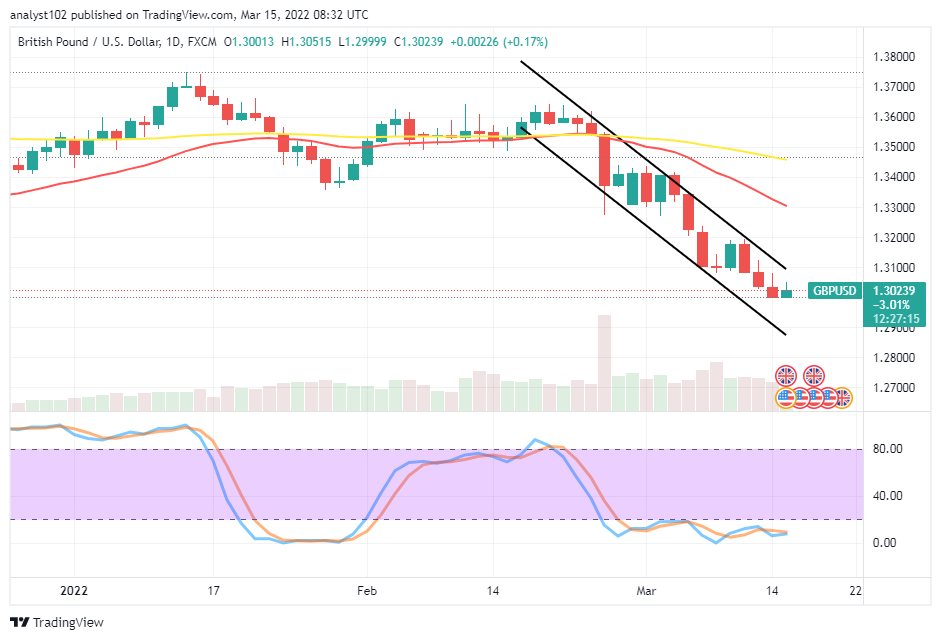
An increase in the GBP/USD price depreciation process has led the currency pair market to consolidate in the bearish channels between the high of 1.3051 and a low of 1.2999. The pair opening balance is around 1.3001, keeping a minute positive percentage of 0.17 as of writing.
GBP/USD Market
Key Levels:
Resistance levels: 1.3100, 1.3200, 1.3300
Support levels: 1.2900, 1.2800, 1.2700
GBP/USD – Daily Chart
The GBP/USD daily chart shows the currency pair market consolidates in the bearish channels. The 14-day SMA indicator is above the 50-day SMA indicator. And they are far above them to indicate that a free fall-off has prevailed over time. The bearish channel trend lines drew to ascertain the depth the market has kept to the downside. The Stochastic Oscillators are in the oversold region, moving in a consolidation manner to signify that falling pressures are ongoing. Will there soon be a rebound in the GBP/USD trade operations as the currency pair market consolidates in the bearish channels?
There has been no indication to signify a change of direction against the GBP/USD present downward trend as the currency pair market consolidates in the bearish channels. Long-position takers will have to be on the lookout for a bounce-off to occur from the depth of a lower trading spot to erase some of the lost profits. While that scenario plays out, traders may begin to long their orders.
On the downside of the technical analysis, short-position takers may hold on to some of the opened sell orders provided they had launched before the 1.3100 resistance level. The emergence of a rebound against the value-line may be a sign of ending a downward-moving process in no time.
Summarily, traders needed to be cautious of exerting new orders as the GBP/USD market consolidates in the bearish channel trend lines. Long-position takers may brace up for a rebounding motion once a bullish candlestick emerges from a depth of lower trading spot before joining the trade. GBP/USD 4-hour Chart
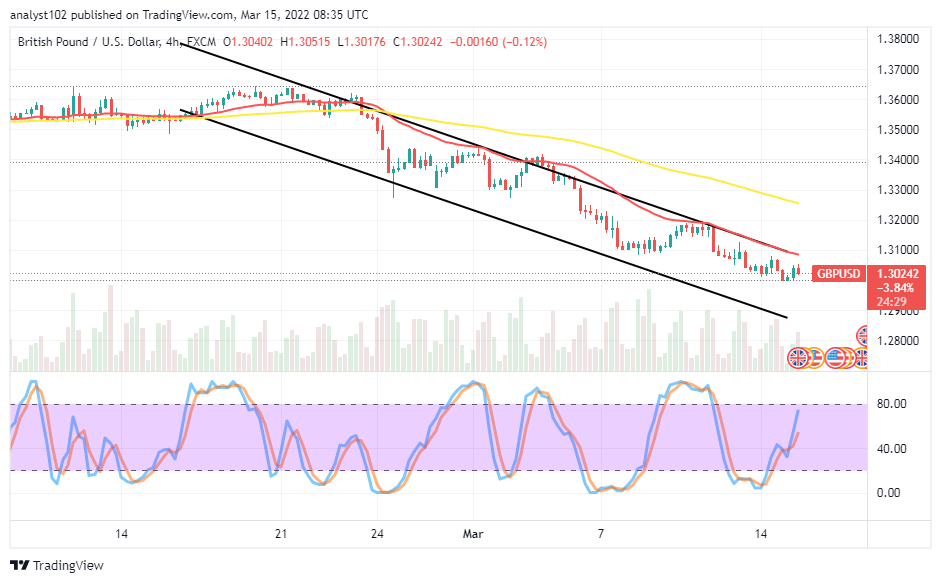
The GBP/USD medium-term chart shows the currency pair market consolidates in the bearish channels. The upper bearish trend line drew alongside the smaller SMA. The 50-day SMA indicator is above the 14-day SMA indicator. Variant candlesticks have featured underneath the trading indicators. The Stochastic Oscillators are in an upward motion toward the range of 80. That denotes an attempt has relatively made by the market to push up. A breakout at 1.3100 is necessary to portend a return of an upward trend is imminent afterward.
Note:Forexschoolonline.com is not a financial advisor. Do your research before investing your funds in any financial asset or presented product or event. We are not responsible for your investing results.


Leave a Reply