GBP/USD Price Prediction – December 6
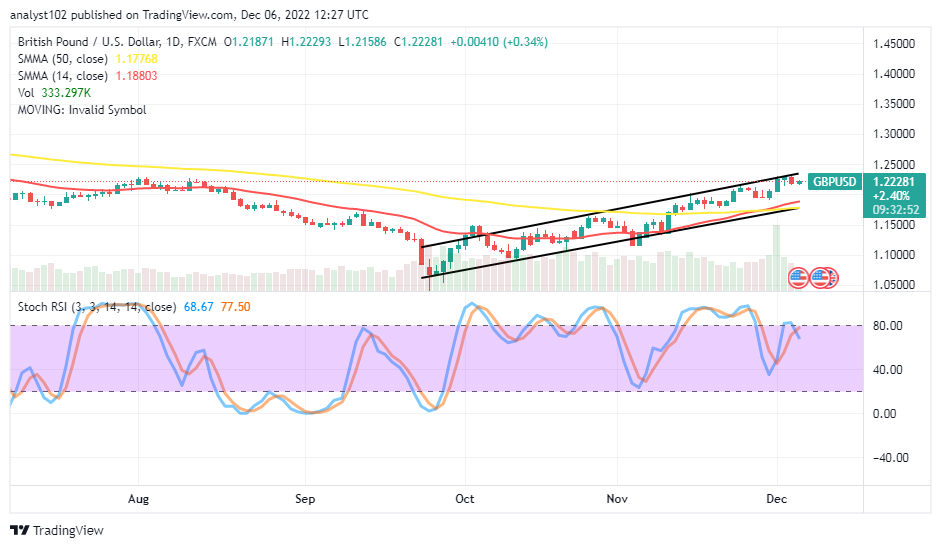
At a closer-technical viewing point, buying mode in the GBP/USD trade has not succembed to an heated declining force as the market advances towatd resistance at the 1.2300 line. The trading spots have been between the high and the low values of 1.22293 and 1.1.21586 at a minute positive percentage rate of 0.34.
GBP/USD Market
Key Levels:
Resistance levels: 1.2300, 1.2400, 1.2500
Support levels: 1.2100, 1.2000, 1.1900
GBP/USD – Daily Chart
The GBP/USD daily chart reveals that the currency pair market advances toward resistance level at the 1.2300. Observantly, price has been featuring closely around the upper bullish trend line drew to indicate that buying momentum has not expired totally despite reaching a high-trading area. The 14-day SMA indicator is at 118803 slightly over the 1.17768 value line of the 50-day SMA indicator. The Stochastic Oscillators have crossed southbound from around the range of 80 to 77.50 and 68.67 levels. 
What is the highest point the bulls on the GBP/USD market can go before hitting a more-difficult resistance?
As the GBP/USD market advances its valuation toward the 1.2300 resistance level, bulls may shift positions to encounter a tougher-barrier trading point around the 1.2500 in the long run. Buyers would be risking a fresh opening of buying order under a profiteering condition when an active bullish move tends to resurface closely below the upper bullish trend line draw.
On the downside of the technical analysis, sellers to be strategic by looking out for a rejection that can emanate during upward pressure before considering launching an instant shorting execution order. A stop loss order may be between1.2350 and 1.2450 points to protect against any potential unnecessary uprising motions,
In summary analytics, it requires a lot of effort on the part of the GBP/USD market bears to patiently wait for a significant bearish candlestick to form between the 1.2300 and 1.2500 levels before getting a decent sell order.
GBP/USD 4-hour Chart
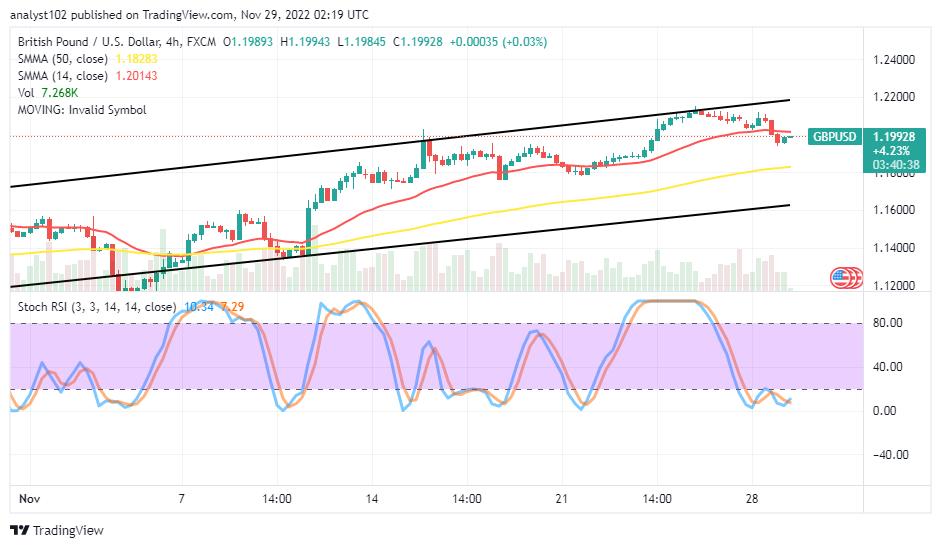
The GBP/USD medium-term chart depicts that the currency pair market has been under a bullish-trending outlook the bigger SMA trend line. The 14-day SMA indicator has been trending northward around the variations of trading candlesticks over the 50-day SMA indicator. The Stochastic Oscillators have dipped into the oversold region, keeping 7.11 and 9.86 levels to denote that a buying force is in the motion as of the time of writing this analytics.
Note: Forexschoolonline.com is not a financial advisor. Do your research before investing your funds in any financial asset or presented product or event. We are not responsible for your investing results.


Leave a Reply