British Pound Price Prediction – September 28
The GBP/USD market activity holds positions around the level of 1.3700 while a line of striving efforts to swing up for a recovery. As of writing, the fiat currency pair trades around 1.3673 at a percentage estimate of about -0.13. That indicates the possibility that the market is merely not being far from a falling pressure.
GBP/USD Market
Key Levels:
Resistance levels: 1.3800, 1.3900, 1.4000
Support levels: 1.3600, 1.3500, 1.3400
GBP/USD – Daily Chart
It is pictured on the GBP/USD daily chart that the fiat-currency pair market activity holds around the line of 1.3700. Initially, the market traded around 1.3600 before the emergence of a bullish candlestick on the September 23rd session that propelled it to that higher trading level. The 14-day SMA indicator is underneath the 50-day SMA indicator. And, the bearish trend line drew between them, serving as a resistance backup to the smaller SMA. The Stochastic Oscillators have closed the lines at range 40. That could mean that price may still hold around its current trading zone for a while.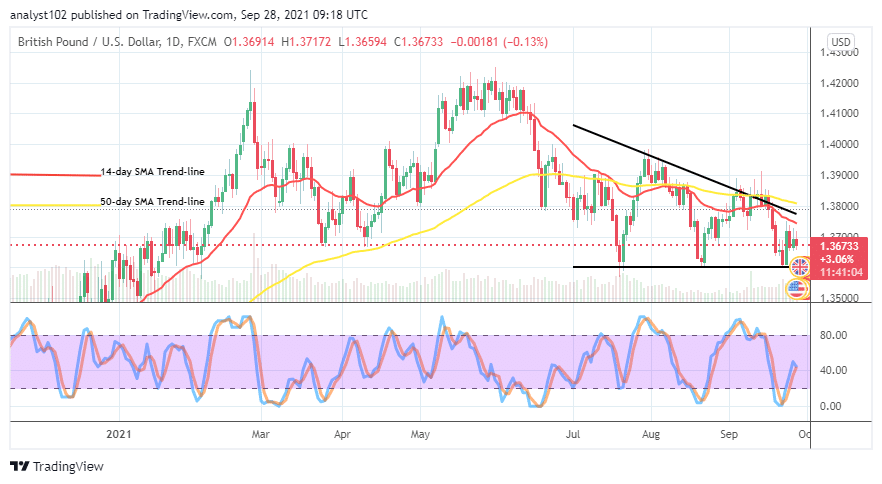 As GBP/USD market activity holds around 1.3700, will there be a reversal motion to break past the 1.3600 level?
The market level at 1.3600 happens to serve as the critical support level that, if price breaches downward, may not sustain it for long. Now that the GBP/USD market activity holds around the 1.3700 level, buyers may have to watch out for active price action that could result from a rallying motion when the market might have pushed down toward or around the level of the smaller value-line mentioned above.
On the downside, it appears that the GBP/USD market bears still have the opportunity to re-depress the currency pair around the trend line of the smaller SMA. Traders needed to adhere to the cognizance of the Stochastic Oscillators’ positioning outlook in their predetermination of the subsequent market’s direction.
Summarily, It seems that the GBP/USD market may still push slightly for more downs, averaging the 1.3600 or better still for a retest so that bulls may have to rejuvenate their presence. A fearful downward breaching of the value line may potentially cause a bears’ trap trading situation afterward.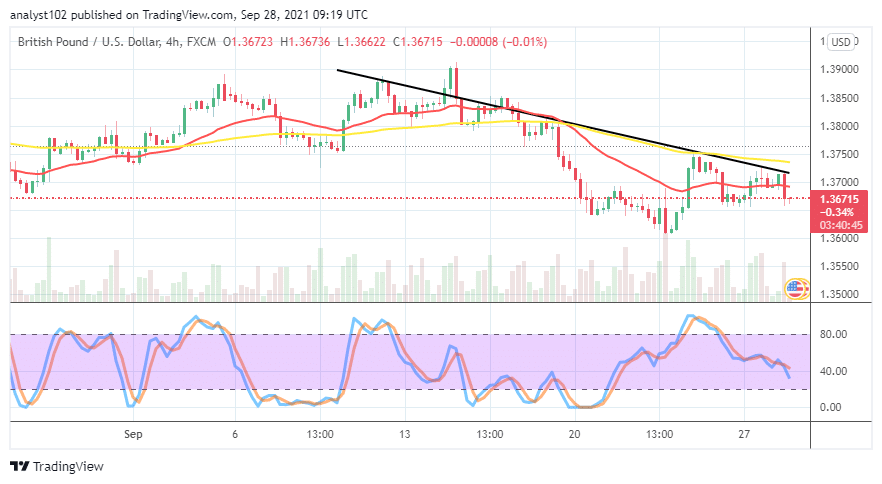 GBP/USD 4-hour Chart
The GBP/USD medium-term chart reveals that the currency pair market activity holds briefly beneath the level of 1.3700. The 14-day SMA trend line is around the value line underneath the 50-day SMA trend line. A 4-hour bearish candlestick appeared against the smaller SMA, leading the market to trade southward. The Stochastic Oscillators keep a southbound-slanting posture from the overbought region across variant lower range lines until it reaches range 40. And, yet, they still somewhat point to the south around the range line. That suggests that some degrees of sell-offs may still play out for a while afterward.
Note: Forexschoolonline.com is not a financial advisor. Do your research before investing your funds in any financial asset or presented product or event. We are not responsible for your investing results.
Learn to Trade Forex Online
GBP/USD Market Activity Holds around 1.3700
Footer

ForexSchoolOnline.com helps individual traders learn how to trade the Forex market
WARNING: The content on this site should not be considered investment advice and we are not authorised to provide investment advice. Nothing on this website is an endorsement or recommendation of a particular trading strategy or investment decision. The information on this website is general in nature so you must consider the information in light of your objectives, financial situation and needs.
Investing is speculative. When investing your capital is at risk. This site is not intended for use in jurisdictions in which the trading or investments described are prohibited and should only be used by such persons and in such ways as are legally permitted. Your investment may not qualify for investor protection in your country or state of residence, so please conduct your own due diligence or obtain advice where necessary. This website is free for you to use but we may receive a commission from the companies we feature on this site.
We Introduce people to the world of currency trading. and provide educational content to help them learn how to become profitable traders. we're also a community of traders that support each other on our daily trading journey
Forexschoolonline.com is not a financial advisor. Do your research before investing your funds in any financial asset or presented product or event. We are not responsible for your investing results.
Leave a Reply