British Pound Price Prediction – June 29
The GBP/USD market now makes a definite bearish path after a notable pull-up to touch a higher value of around 1.4000. Price is presently trading at the level of 1.3841 at a reduced rate of around -0.25 percent.
GBP/USD Market
Key Levels:
Resistance levels: 1.3900, 1.4000, 1.4100
Support levels: 1.3800, 1.3700, 1.3600
GBP/USD – Daily Chart
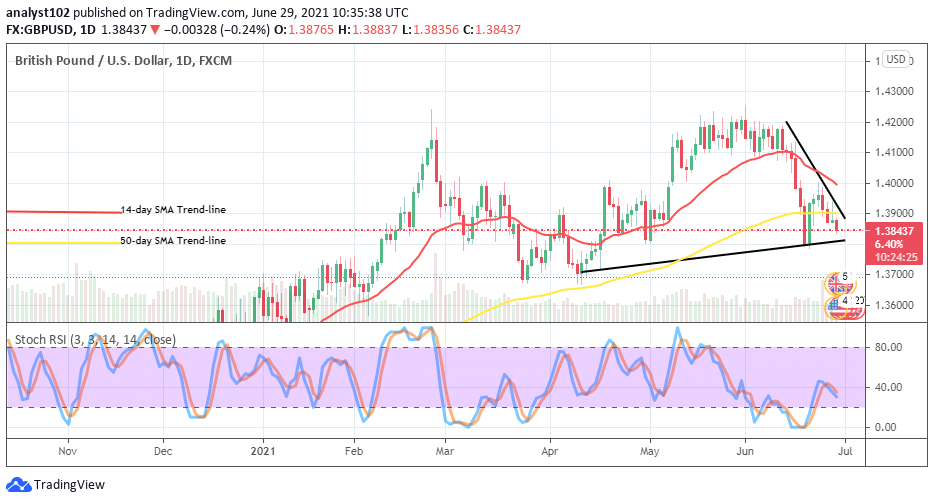
The GBP/USD daily chart has shown that the currency pair makes a definite path for a bearish trend. A line of bearish candlesticks representing the actual movement of the trade has formed southward past the trend-line of the bigger SMA. The 14-day SMA trend-line is above the 50-day SMA trend-line as the bearish trend-line drew across them to the downside. The bullish trend-line has relatively drawn northbound to place at a critical level of 1.3800. The Stochastic Oscillators have crossed the lines in a slight slantingly manner to the south across range 40. That suggests the possibility that the price may decline further. Bearish or bullish trend, which one trader may look out for in the next session?
The GBP/USD market operations have entered a new round of trending downward. Therefore, traders needed to be on the lookout for decent sell entries before placing a position in the market. Meanwhile, the value around the level of 1.3700 will be focus should the line of 1.3800 break down afterward. The smaller value’s trading zone earlier mentioned has a higher profile chance of witnessing a rebound should price drawdown to the point.
In the trading habit of seeing a downward movement continuation of this currency pair’s trade, bears needed to hold their presence more importantly around the level of 1.3900 to keep the current bearish path valid. Failure of that assumption will allow the market to revisit the previous higher value of 1.4000. After, the downward may tend to return in following the path back to the downside.
Summarily, bears appear to dominate the currency pair’s trend of GBP/USD. Traders needed to be on the lookout for a reversal of pulling ups after that price hits a resistance around the bearish trend-line or the smaller SMA trend-line before placing a sell order. GBP/USD 4-hour Chart
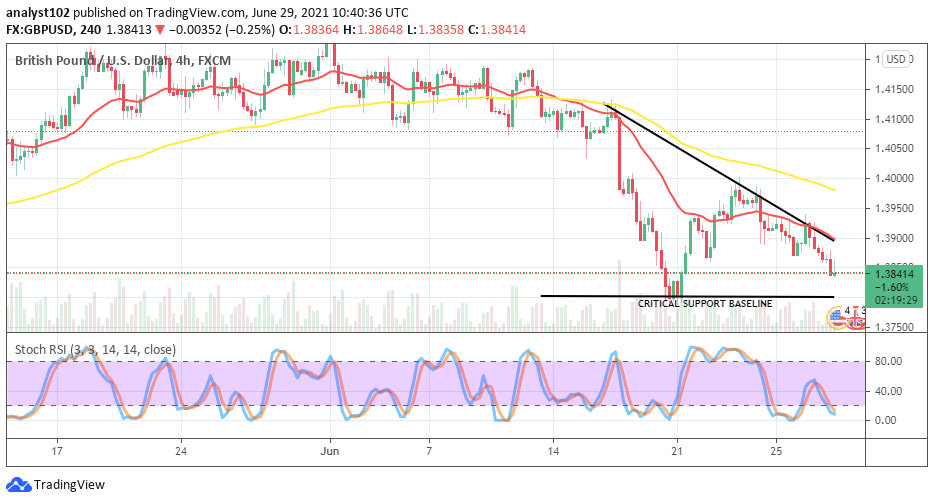
It is shown on the GBP/USD medium-term chart that the currency pair’s valuation has reverted into following a downward trend after hitting resistance at 1.4000. The bearish trend-line has conjoined with the 14-day SMA trend-line at a lower end of the trading zone underneath the 50-day SMA trend-line. The market currently averages the critical support baseline at 1.3800. The Stochastic Oscillators are freshly in the oversold region to point southbound to indicate that the downward force isn’t exhausted yet. An eventual breakdown of the point; may potentially the market into looking for support around the lower level of 1.3700.
Note: Forexschoolonline.com is not a financial advisor. Do your research before investing your funds in any financial asset or presented product or event. We are not responsible for your investing results.
Learn to Trade Forex Online
GBP/USD Makes a Definite Bearish Path
Footer

ForexSchoolOnline.com helps individual traders learn how to trade the Forex market
WARNING: The content on this site should not be considered investment advice and we are not authorised to provide investment advice. Nothing on this website is an endorsement or recommendation of a particular trading strategy or investment decision. The information on this website is general in nature so you must consider the information in light of your objectives, financial situation and needs.
Investing is speculative. When investing your capital is at risk. This site is not intended for use in jurisdictions in which the trading or investments described are prohibited and should only be used by such persons and in such ways as are legally permitted. Your investment may not qualify for investor protection in your country or state of residence, so please conduct your own due diligence or obtain advice where necessary. This website is free for you to use but we may receive a commission from the companies we feature on this site.
We Introduce people to the world of currency trading. and provide educational content to help them learn how to become profitable traders. we're also a community of traders that support each other on our daily trading journey
Forexschoolonline.com is not a financial advisor. Do your research before investing your funds in any financial asset or presented product or event. We are not responsible for your investing results.

Leave a Reply