British Pound Price Prediction – June 1
There has been a continual price hovering around the resistance level of 1.4200 over a couple of days’ trading operations. As of writing, the base currency’s value trades at about 1.4186 at a rate of -0.14% decrease.
GBP/USD Market
Key Levels:
Resistance levels: 1.4300, 1.4400, 1.4500
Support levels: 1.3900, 1.3800, 1.3600
GBP/USD – Daily Chart
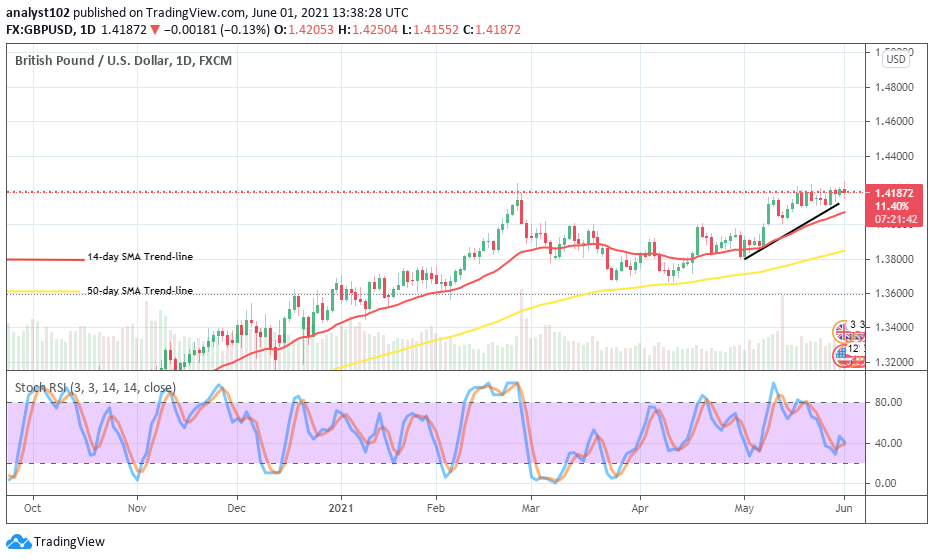
The GBP/USD daily chart showcases that the market trading zone of 1.4200 has remained the critical point where price has been continually resisted. There has been a formation of variant candlesticks mostly featured to depict a kind of range-bound trading situation of the market presently. The bullish trend-line drew on a little-lengthy outlook above the buy signal side of the smaller SMA to place close below the current trading point of the currency pair. The 50-day SMA indicator is located underneath the 14-day SMA trend-line. The Stochastic Oscillators are now heading downward to place around range 40. With the tight featuring of a candlestick around the major resistance trading zone, it is not clear that price will fall visibly in the next session.
When will the GBP/USD market stop hover around the resistance of 1.4200?
The GBP/USD market hovering around the resistance of 1.4200 tends to prolong the outlook until some days’ trading activities. Bulls in the market are seemingly getting set to lose the momentum to push northward above the value earlier mentioned. In light of that, buying position needs to be suspended.
The resistance trading line of 1.4200 stands to be a decent zone that potential drawdown could take to form in no time. It will be a better chance if price makes a slight shoot-up before reversing back to the point so that a sell pending position could trigger active trading. However, a forceful breakout of the value may lead bears to reset their stance at a higher zone.
Summarily, the GBP/USD bulls needed to intensify efforts to surge past the resistance level of 1.4200. Meanwhile, around that value as well, bears would have to hold their positions strong to exert pressure on the market. GBP/USD 4-hour Chart
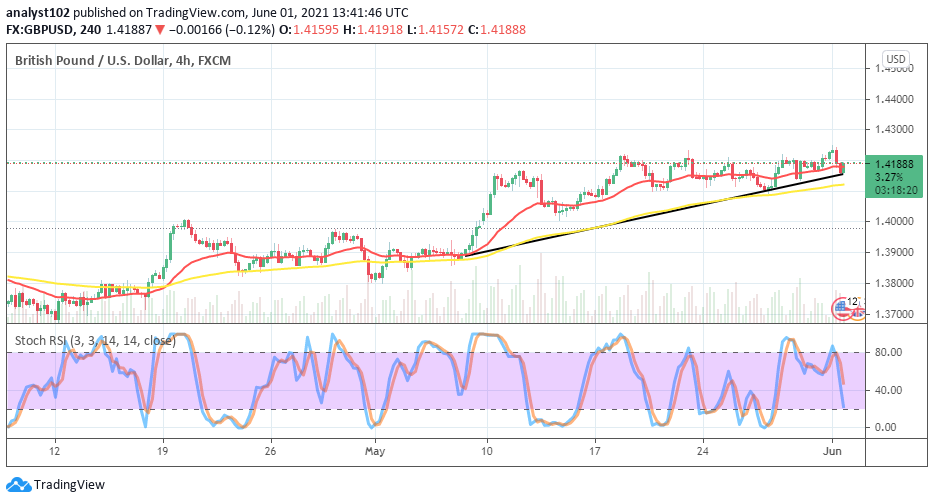
There has been a slow and steady movement in the market valuation of GBP/USD on the 4-hour trading chart. Since around May 6, the market has continued to feature in a bullish trend outlook from lower support of 1.3900 to now trade hovering around the resistance of 1.4200. The 14-day SMA trend-line is located close below the point later mentioned above the 50-day SMA. The bullish trend-line drew in between the small space of the SMAs. The Stochastic Oscillators have swerved facing downward to probably suggest downsize in the currency pair’s valuation. However, it may not long-lived until the next operation. Therefore, bears have to be wary of their stance.
Note: Forexschoolonline.com is not a financial advisor. Do your research before investing your funds in any financial asset or presented product or event. We are not responsible for your investing results.
Learn to Trade Forex Online
GBP/USD Keeps Hovering Around Resistance of 1.4200
Footer

ForexSchoolOnline.com helps individual traders learn how to trade the Forex market
WARNING: The content on this site should not be considered investment advice and we are not authorised to provide investment advice. Nothing on this website is an endorsement or recommendation of a particular trading strategy or investment decision. The information on this website is general in nature so you must consider the information in light of your objectives, financial situation and needs.
Investing is speculative. When investing your capital is at risk. This site is not intended for use in jurisdictions in which the trading or investments described are prohibited and should only be used by such persons and in such ways as are legally permitted. Your investment may not qualify for investor protection in your country or state of residence, so please conduct your own due diligence or obtain advice where necessary. This website is free for you to use but we may receive a commission from the companies we feature on this site.
We Introduce people to the world of currency trading. and provide educational content to help them learn how to become profitable traders. we're also a community of traders that support each other on our daily trading journey
Forexschoolonline.com is not a financial advisor. Do your research before investing your funds in any financial asset or presented product or event. We are not responsible for your investing results.

Leave a Reply