The US dollar seems to be exhibiting improving sentiment as speculative interest regresses. This confers a calmer look to the greenback ahead of the US CPI. As a result, this has resisted a continued upside retracement in the GBP/USD pair at a psychological resistance price level.
Key Price Levels:
Resistance Levels: 1.2800, 1.2900, and 1.3000
Support Levels: 1.2700, 1.2600, and 1.2500

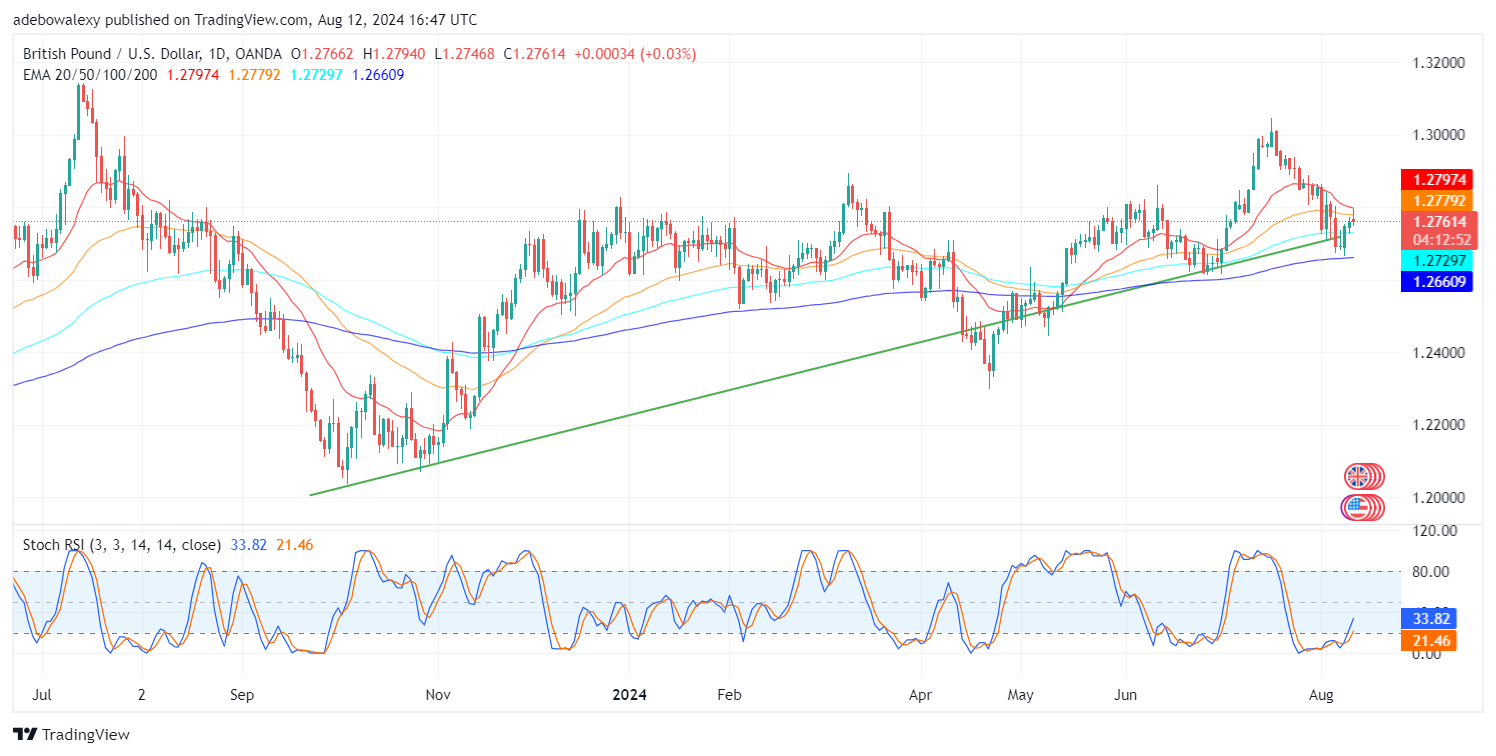
GBP/USD Bounces Off the 20-Day EMA Curve
The 1.2800 price threshold has presented a strong barrier to upside retracement in the GBP/USD market. This is displayed through the last price candle on the chart, which has a longer upper shadow than the lower one.
This demonstrates that price activity may be trapped between the 20-day and 200-day Exponential Moving Average (EMA) lines. The 20-day EMA aligns with the 1.2800 mark, which forms resistance to price action. Meanwhile, the Stochastic Relative Strength Index (SRSI) lines are still rising, aiming towards the 40 level of the indicator.

GBP/USD Downward Rejection Seems Stronger
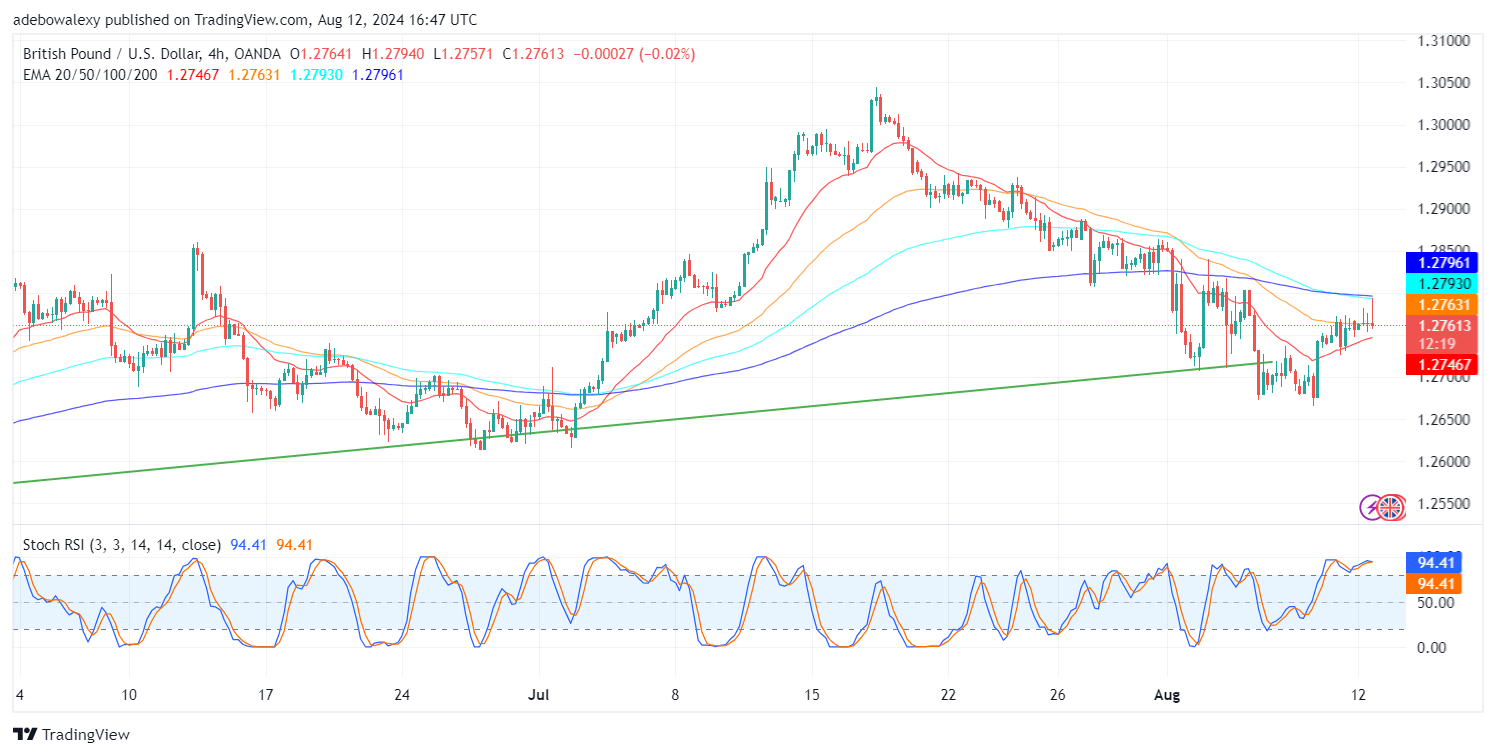
The GBP/USD market on a 4-hour chart has a more bearish outlook. Here, it can be seen that the pair is currently trading below the 50-day EMA curve. Additionally, the price candle reveals that downward forces have exerted strong bearish pressure on price movement in today’s session. It is worth noting that the 200-day and 100-day EMA curves have converged for a crossover above price movement.
Moreover, the SRSI lines are in the overbought region and converge for a crossover. Summing this up, it appears that the market has a bearish outlook on the upside. However, the upcoming US CPI data will play a key role in deciding if the market will descend further towards the 1.2700 mark.
Do you want to take your trading to the next level? Join the best platform for that here.


Leave a Reply