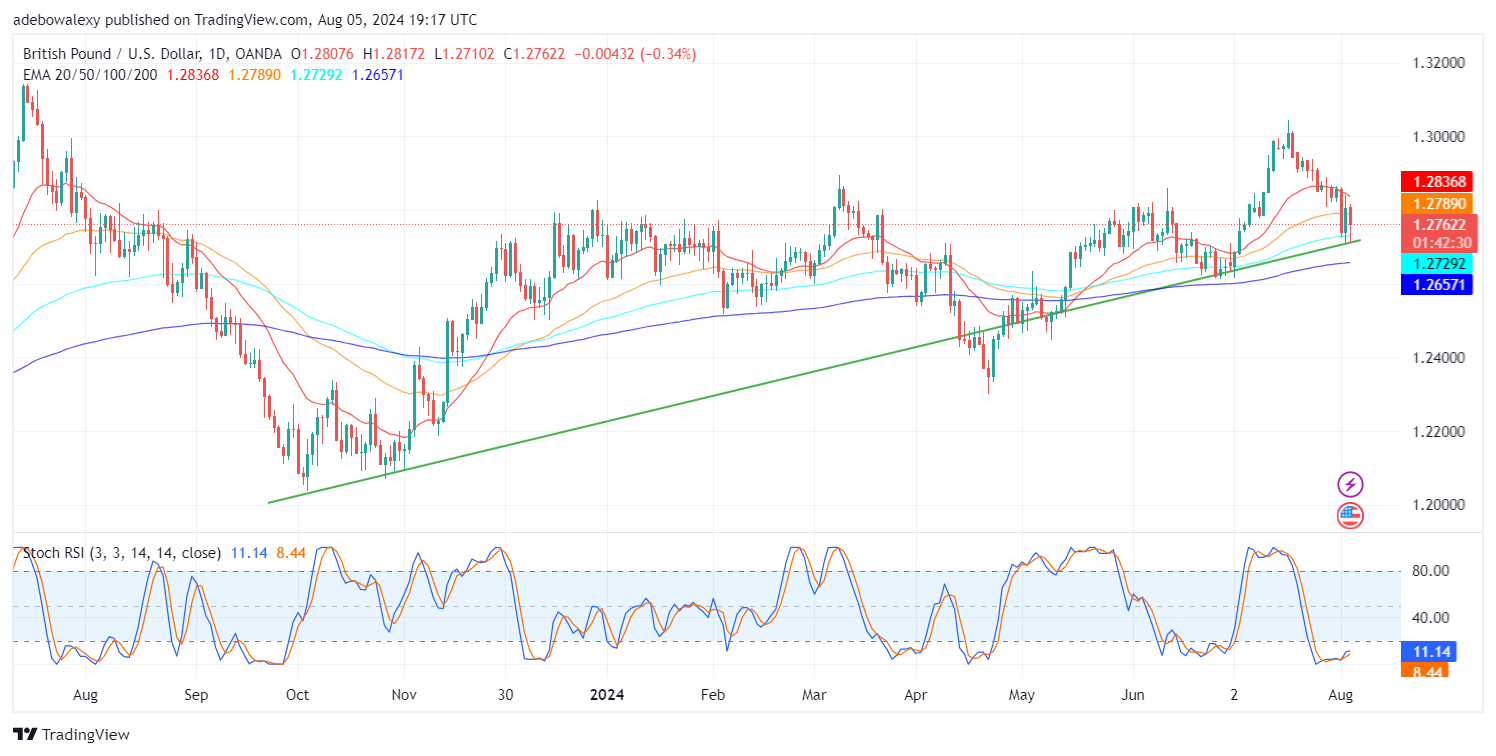
Price action in the GBP/USD market rebounded downward off the resistance at the 1.3000 mark. Today’s trading activity has witnessed significant volatility towards lower support levels. This has remained so despite the bearish sentiment surrounding the US dollar as the Federal Reserve calls for an emergency meeting ahead of the September rate cut.
Key Price Levels:
Resistance Levels: 1.2800, 1.3000, and 1.3200
Support Levels: 1.2600, 1.2400, and 1.2000

GBP/USD Respects the Upside Sloping Trendline
As noted earlier, GBPUSD price activity has been able to trade above the drawn upside-sloping trendline on the daily chart. The price candle indicating the ongoing session shows that the market is quite volatile and has posted a moderate downward correction in the session.
Nevertheless, the pair continues to trade above the 100-day Exponential Moving Average (EMA) lines. The Stochastic Relative Strength Index (SRSI) indicator lines stick to a generally upward trajectory from deep in the oversold region, maintaining the impression that price action may stay above the trendline.

GBP/USD Tries to Keep Up with Upside Prospect
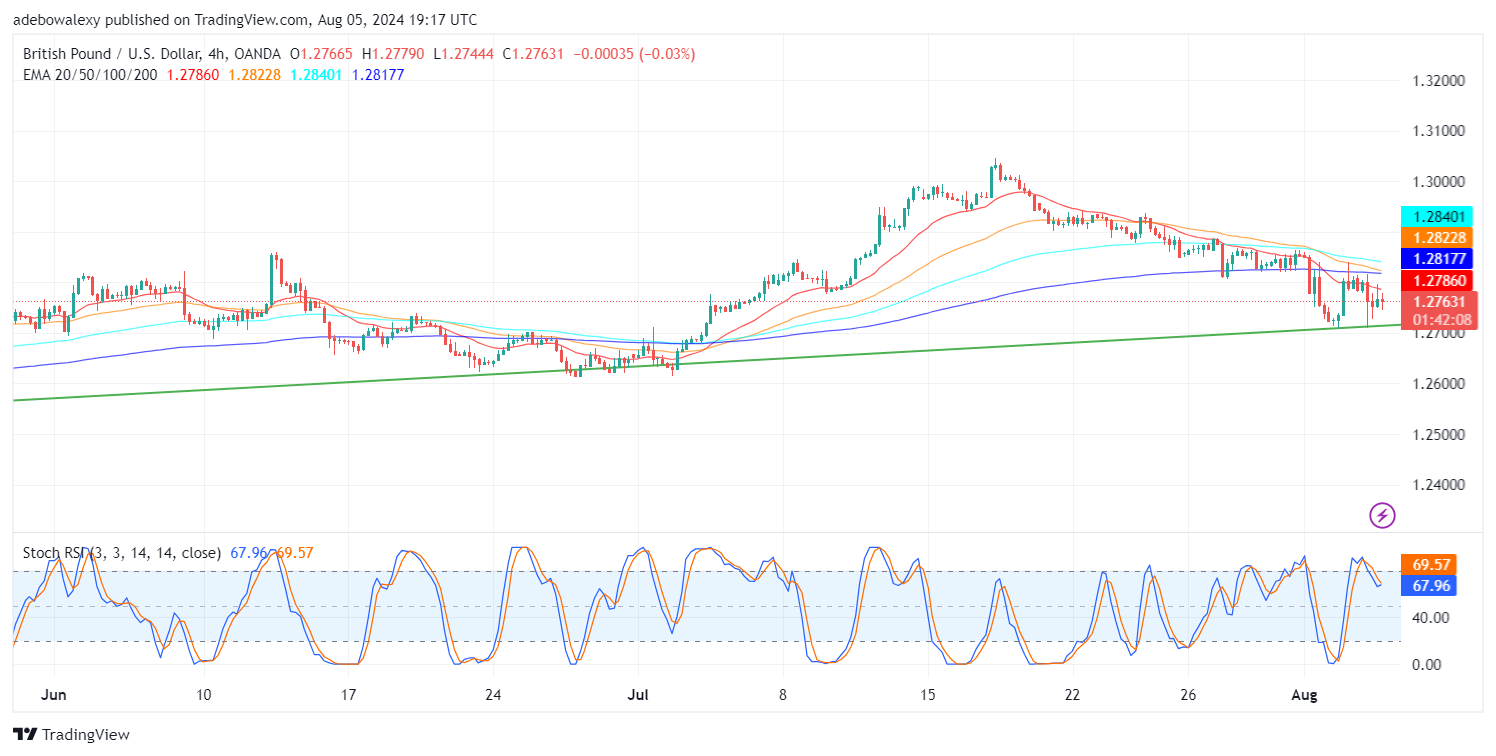
Coming to the GBP/USD 4-hour market, we can see that the new session remains bearish, yet the corresponding price candle has appeared higher than the opening of the previous session. Nevertheless, price activity remains below all the EMA lines.
Meanwhile, the SRSI indicator lines can be seen converging for a bullish crossover around the 70 mark of the indicator. Technically, this hints that upside forces are making an effort to push the market forward. To this effect, traders might want to watch Fed Daly’s speech for some clues, while staying abreast of relevant fundamentals that may lead the way toward the 1.2800 threshold.
Do you want to take your trading to the next level? Join the best platform for that here.


Leave a Reply