Price action in the GBP/USD market continues to show fair signs that the pair may regain the 1.2100 price mark. Nevertheless, the effect of the headwind has been felt in this market, as it has presented some impedance to the price upside move.
Major Price Levels:
Top Levels: 1.2045, 1.2075, and 1.2120
Floor Levels: 1.2015, 1.2000, and 1.1980

GBP/USD Price Stays an Important Support Despite Headwind
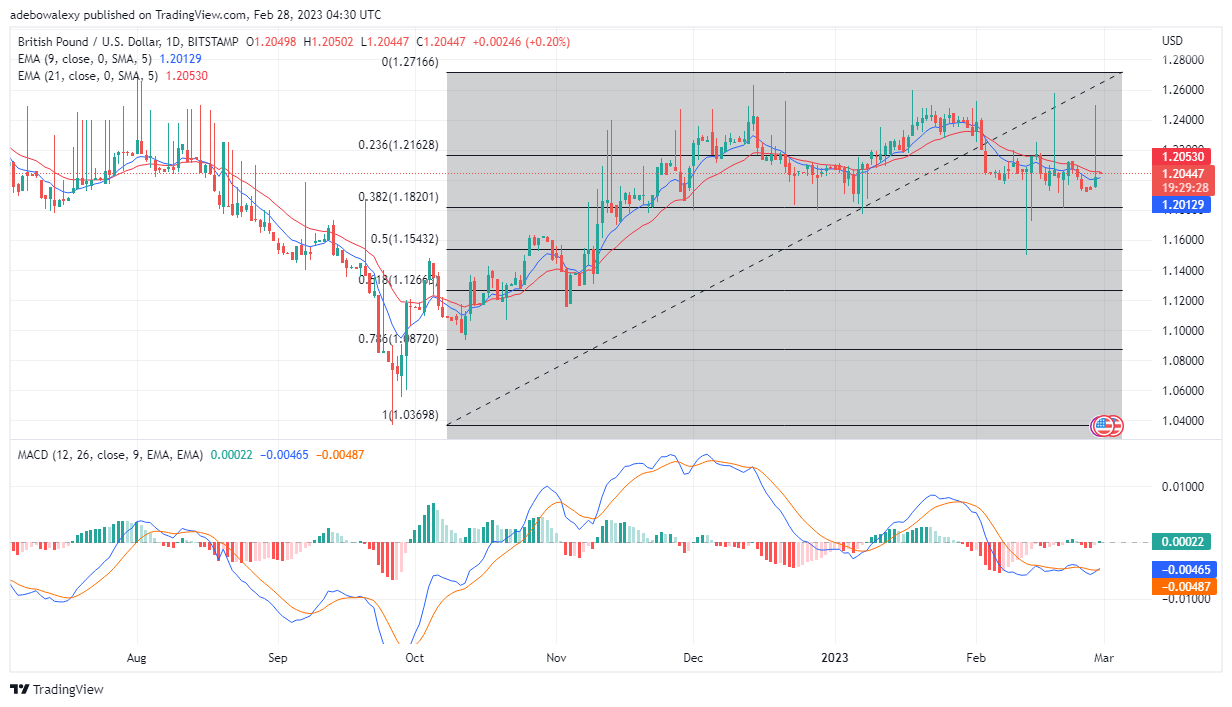
GBP/USD bulls seem to be putting up a good fight against downward forces. On the daily chart, it can be seen that a dash of red price candle has appeared above the green candle for the previous session. It could be noticed that there is some distance between the two candles. Also, it could be seen that price activities are now occurring between the 9- and 21-day. In addition, although the MACD lines are below the 0.00 level, they have delivered a bullish crossover. Additionally, a tiny green price candle has appeared above the equilibrium level. By all indications, traders can anticipate that upside momentum may grow stronger from here and the price will continue moving upward.

GBP/USD Keep Showing Upside Promises
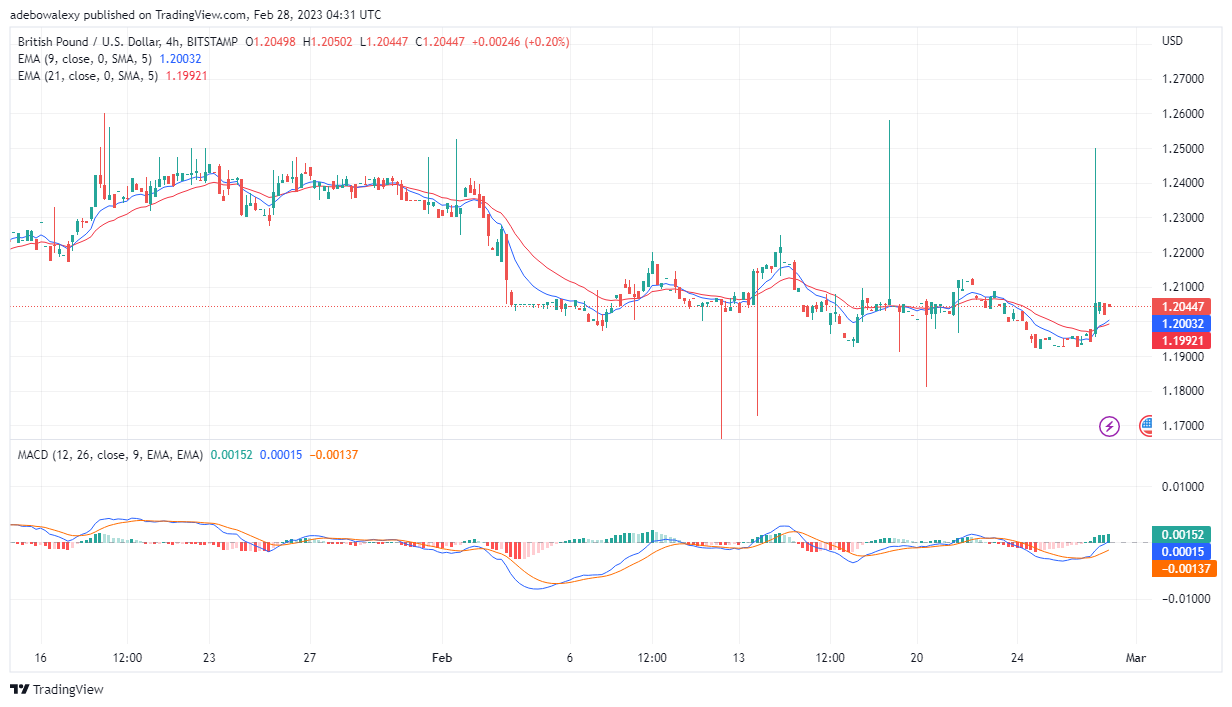
Price action in the GBP/USD 4-hour market continues to show upside promises. Through the last price candle on this chart, it appears as if headwinds are being beaten back, considering the length of this price candle and the one before it. Also, it could be seen that price action is now above the 9- and 21-day EMA curves. Furthermore, the MACD indicator lines are still moving upward, with the tips of its leading lines now above the equilibrium level. Additionally, the green bars of the MACD are still green and of considerable length. Therefore, it appears that the pair’s price may move toward 1.2150.
Do you want to take your trading to the next level? Join the best platform for that here.


Leave a Reply