Fundamentals surrounding the US dollar suggest that the greenback is gaining traction. Consequently, this has initiated a continued downward correction in the GBP/USD pair. From the better-than-expected Nonfarm payroll data to the decreasing unemployment rate, the US seems to be performing well. This may influence the upcoming rate cut.
Key Price Levels:
Resistance Levels: 1.3100, 1.3250, 1.3400
Support Levels: 1.3000, 1.2900, 1.2800

GBP/USD May Edge Lower
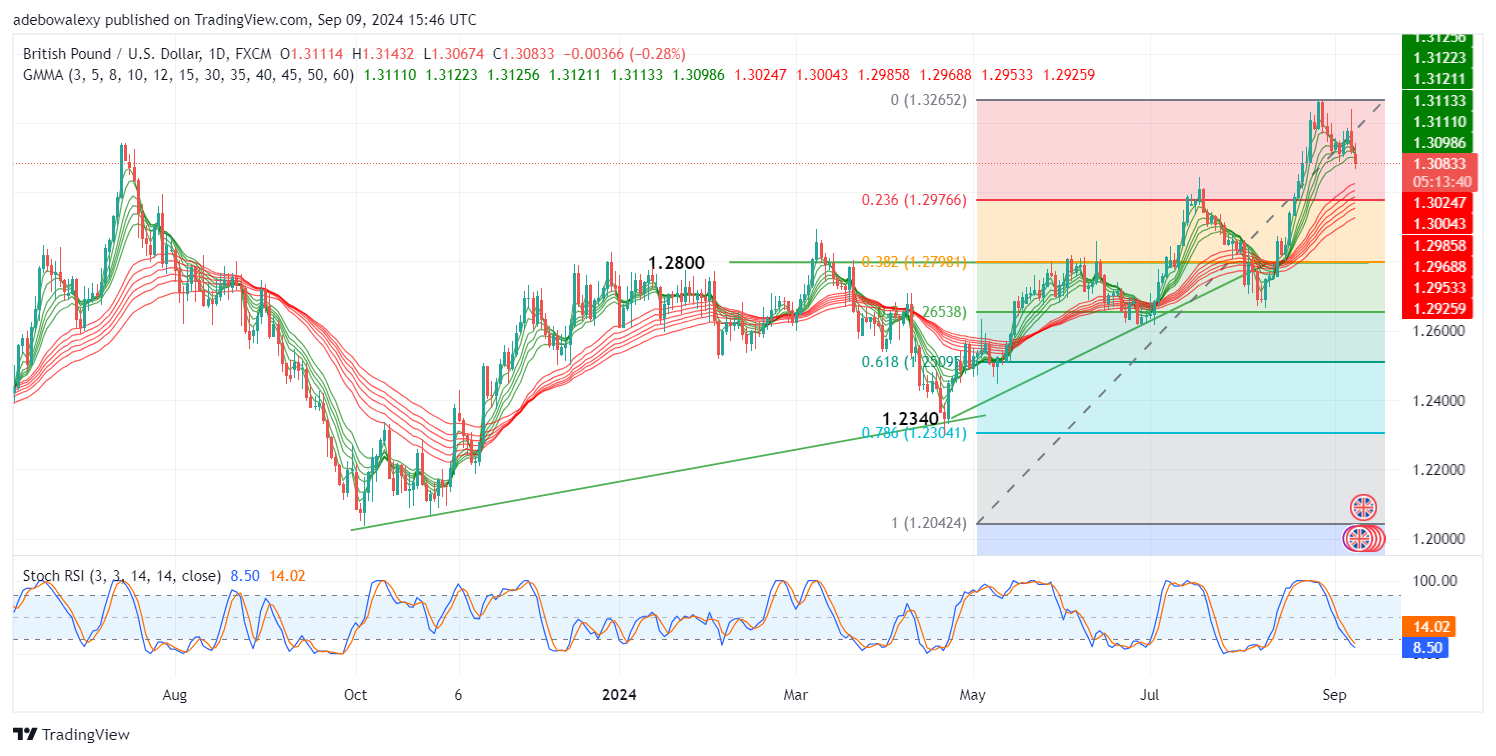
Ever since price activity in the GBP/USD market rebounded off the uppermost limit of the Fibonacci Retracement level, it appears that price action has been finding lower support levels. This saw the market retreat below the 1.3100 threshold.
The ongoing session has also placed the pair’s price below all the green sets of the Guppy Multiple Moving Average (GMMA) lines. Additionally, the Stochastic Relative Strength Index (Stochastic RSI) lines still have a downward trajectory and have reached the oversold region. Technically, trading indicators reveal that the market has bearish potential that may push it lower.

Bears Maintain a Prominent Stance in the GBP/USD Market
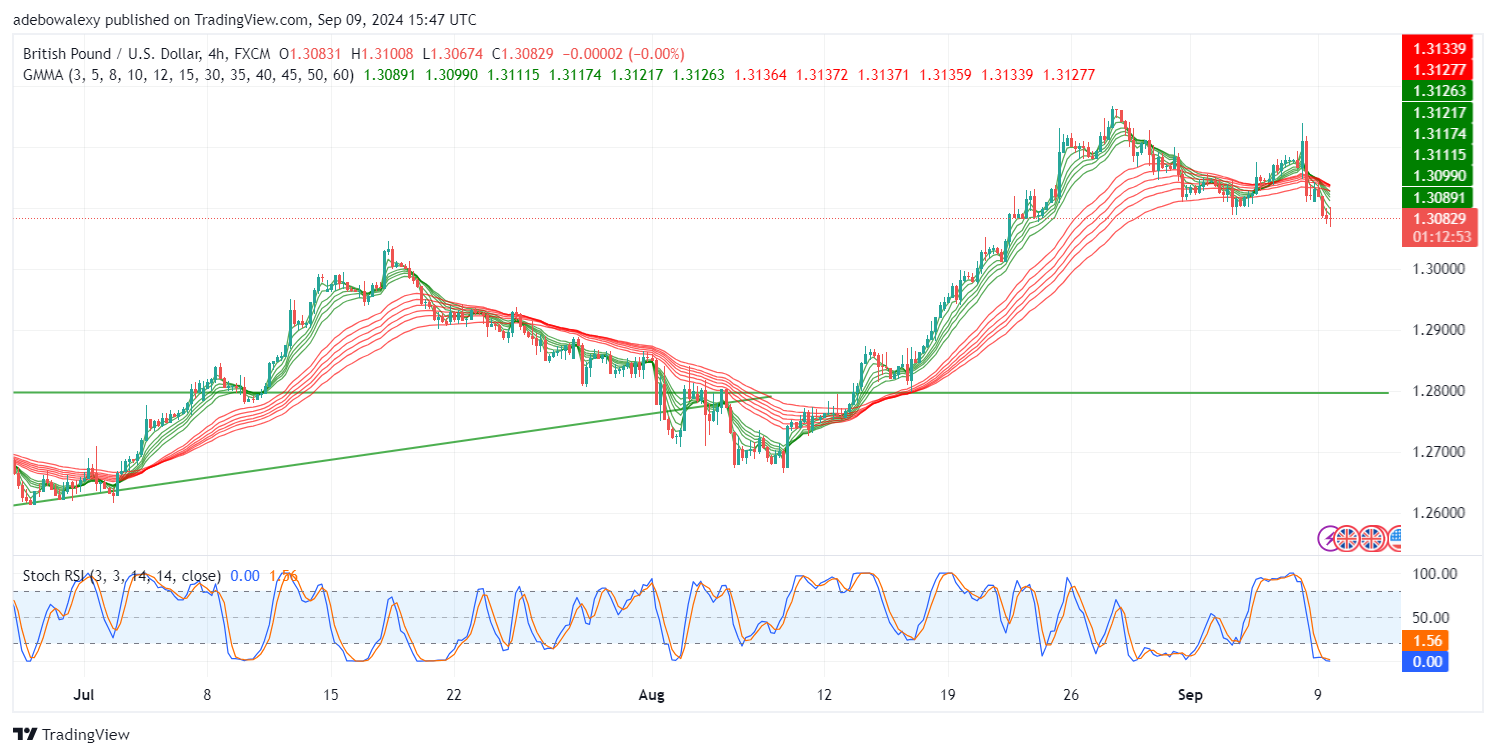
While price activity in the 4-hour GBP/USD market has only fallen below the green set of the GMMA indicator lines, it has fallen below both the green and red sets of the indicator. Furthermore, a crossover has occurred above price action, hinting that headwinds may gain more momentum.
The price candle on the chart appears like a doji candle, indicating that the ongoing session is under intense pressure. The Stochastic RSI indicator lines are already at their lowest in the oversold region, with the lines dragging sideways. At this point, price action seems to possess more bearish potential. Thus, traders can aim at the 1.3050 and 1.3000 price levels.
Do you want to take your trading to the next level? Join the best platform for that here.


Leave a Reply