As I write this daily chart setup commentary for you, price action is making really solid attempts to break out higher of three Great British Pound = GBP, Forex pairs. These pairs are the GBPAUD, GBPSGD and the GBPCAD.
All of these markets have very similar-looking daily charts, in that price made a large leg lower, then paused at a support level before continuing and breaking lower. Price then rotated back higher to be where it is now, making a move against the recent momentum.
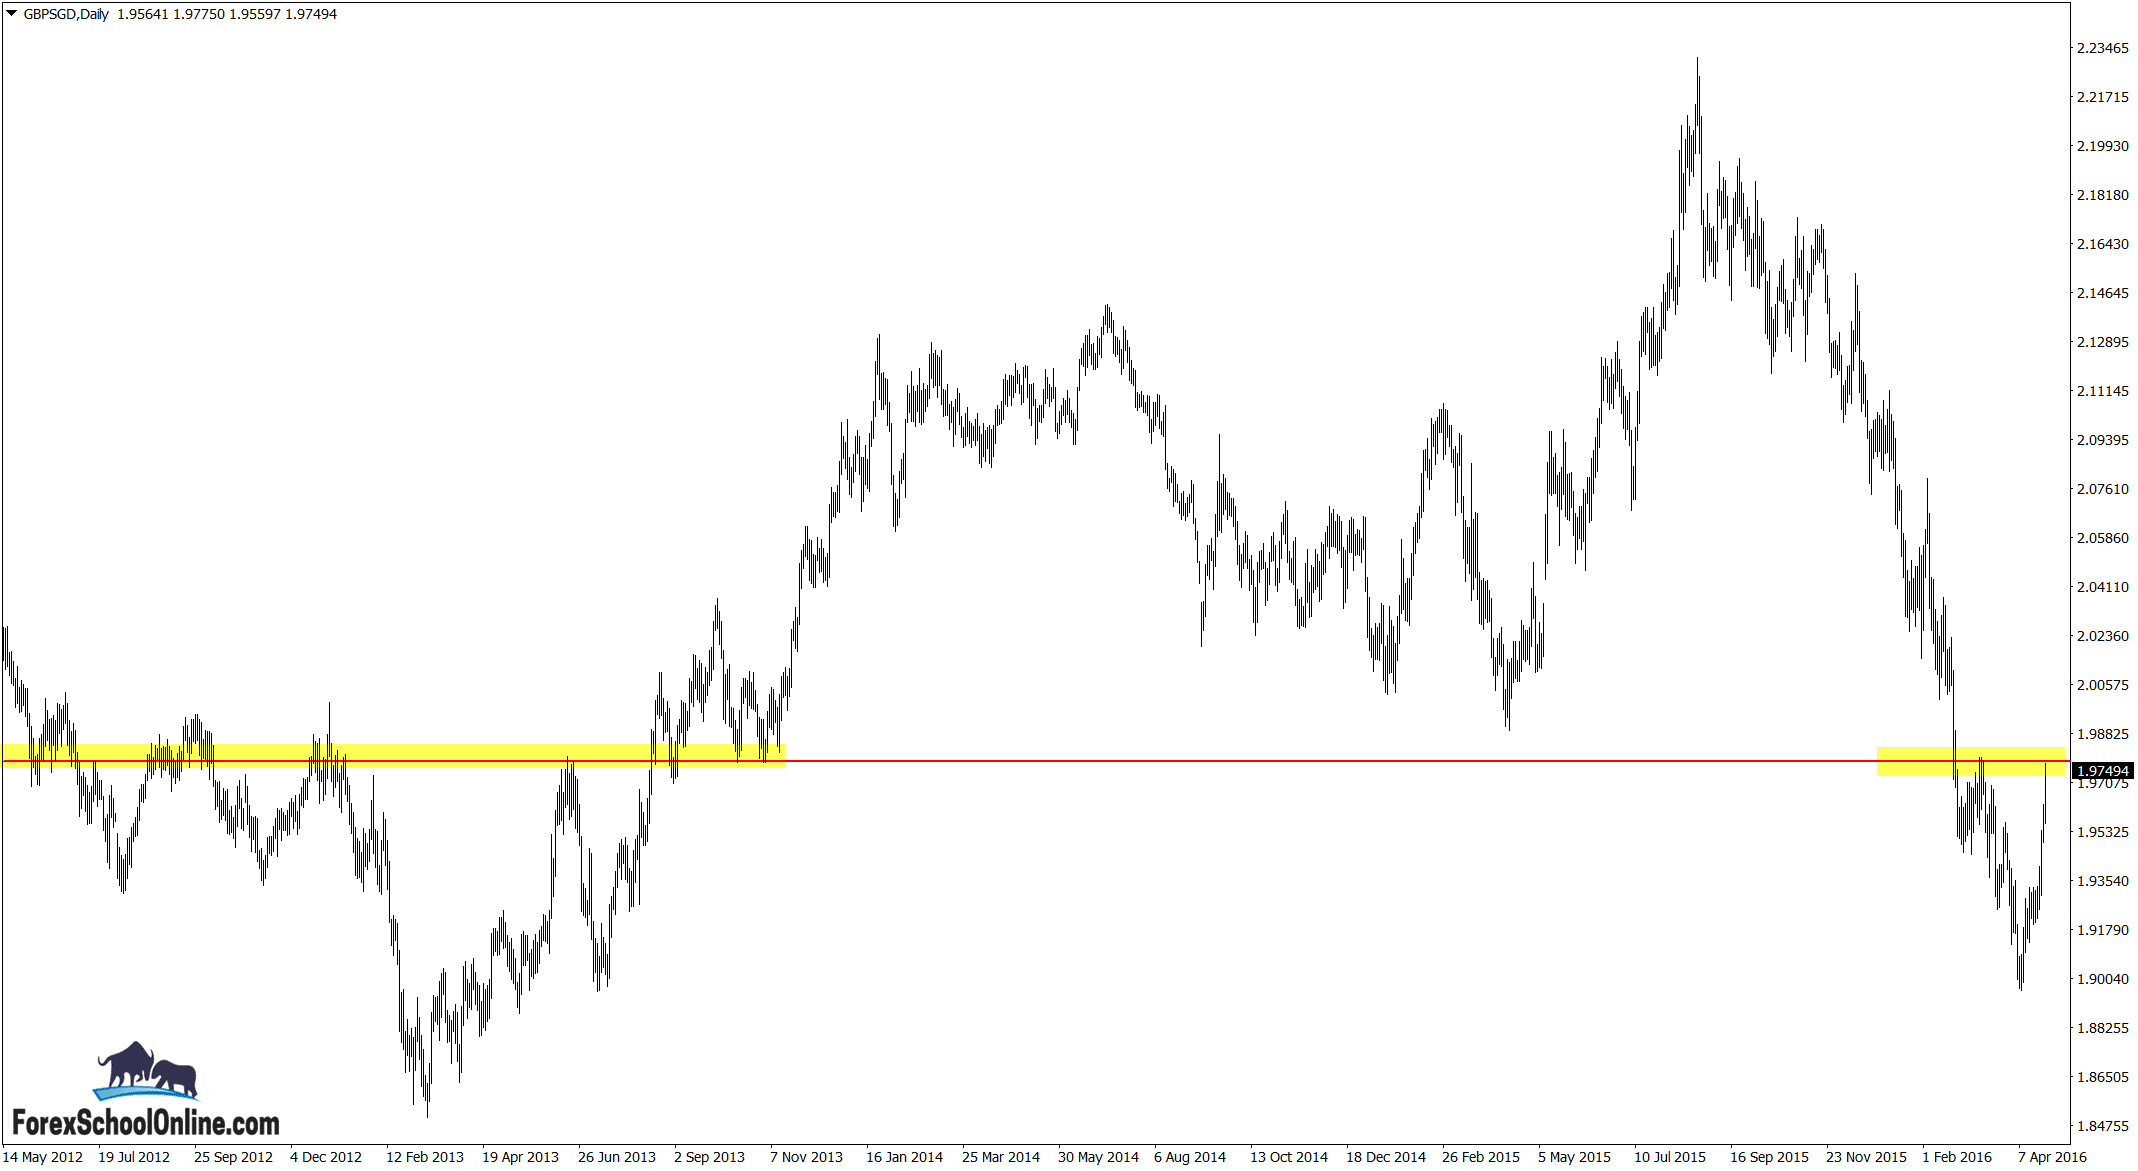
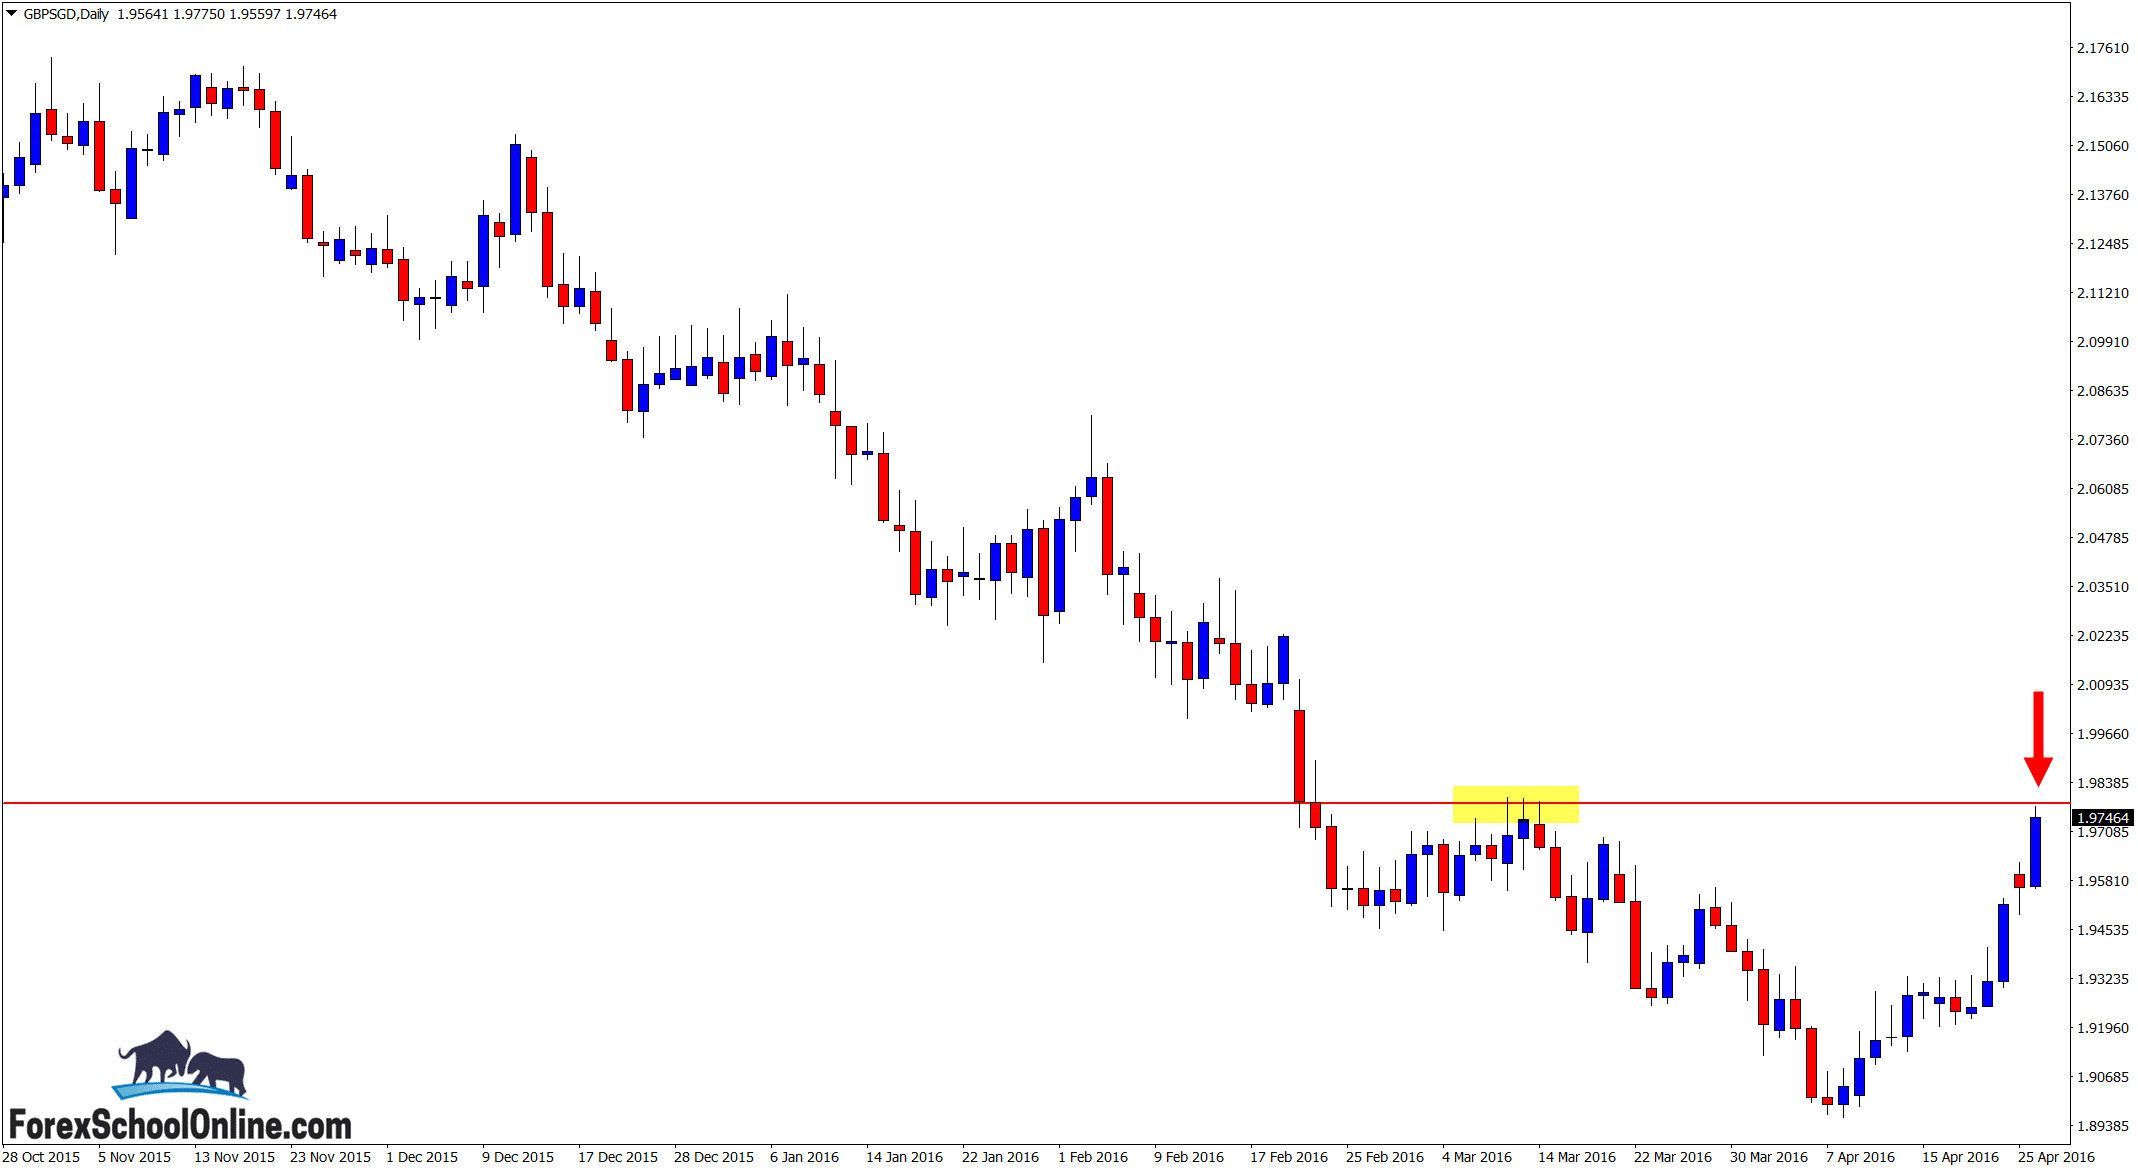
GBPSGD Daily Chart
This is a major and long-term proven price flip level. I recommend that you not only take a look at my chart and level below, but you have a look at your chart of this pair and zoom out to see how this level has flipped on itself.
A potential bearish setup on the larger time frames (such as the daily chart) could be a trigger to look for short trades with the recent short momentum. If price was to move and close back above this price flip level, then our analysis would also flip with it.
Daily Chart

Daily Chart

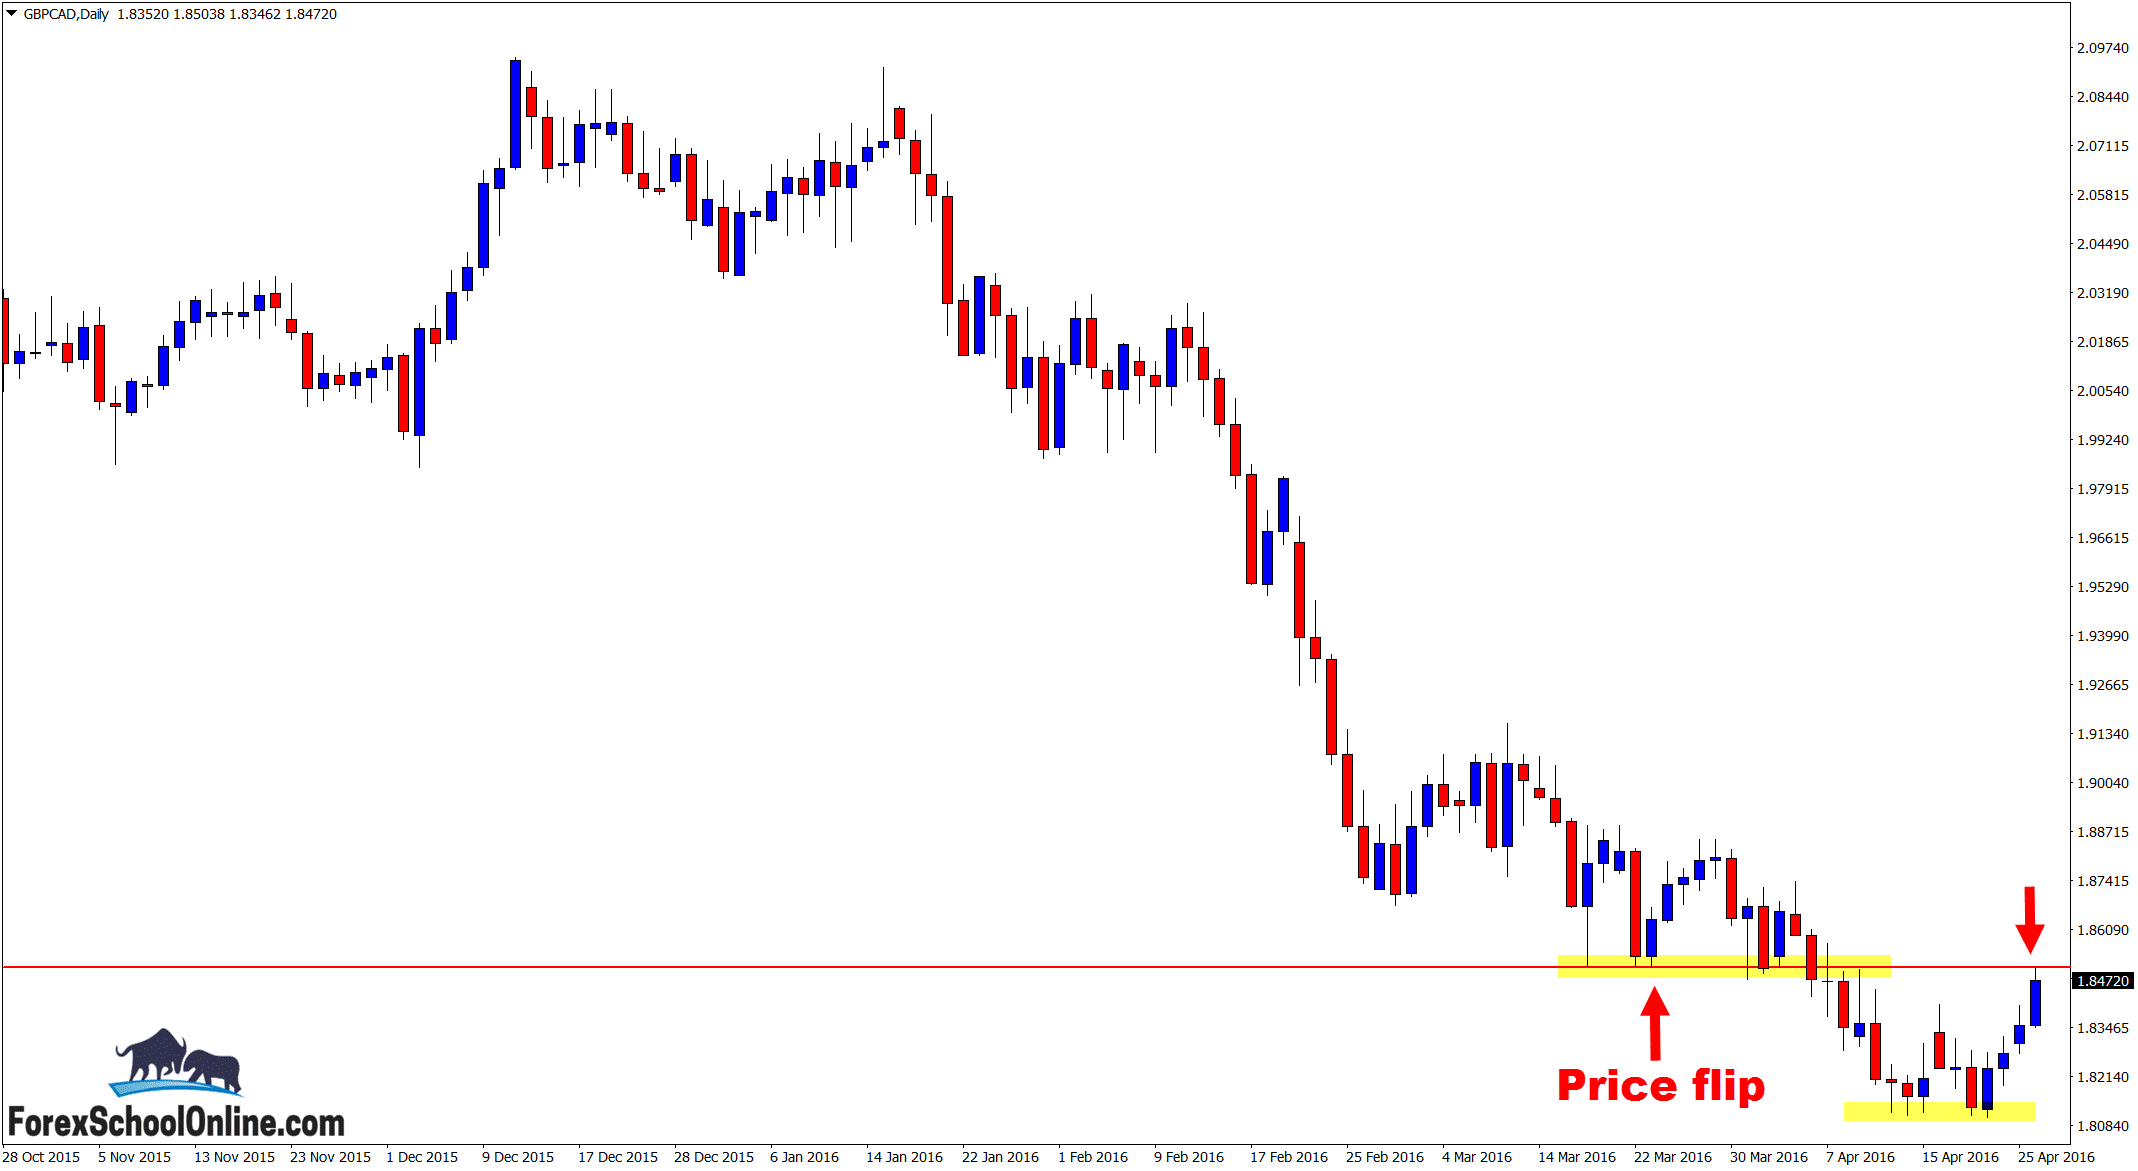
GBPCAD Daily Chart
Out of the three GBP pairs, this had the most shallow retrace or rotation back into resistance. This normally means that it has the highest chance of quickly rolling back over and continuing with the strong move. The simple reason for this is because the higher and longer the retrace or rotation against a trend goes on, the more the momentum builds up.
Daily Chart

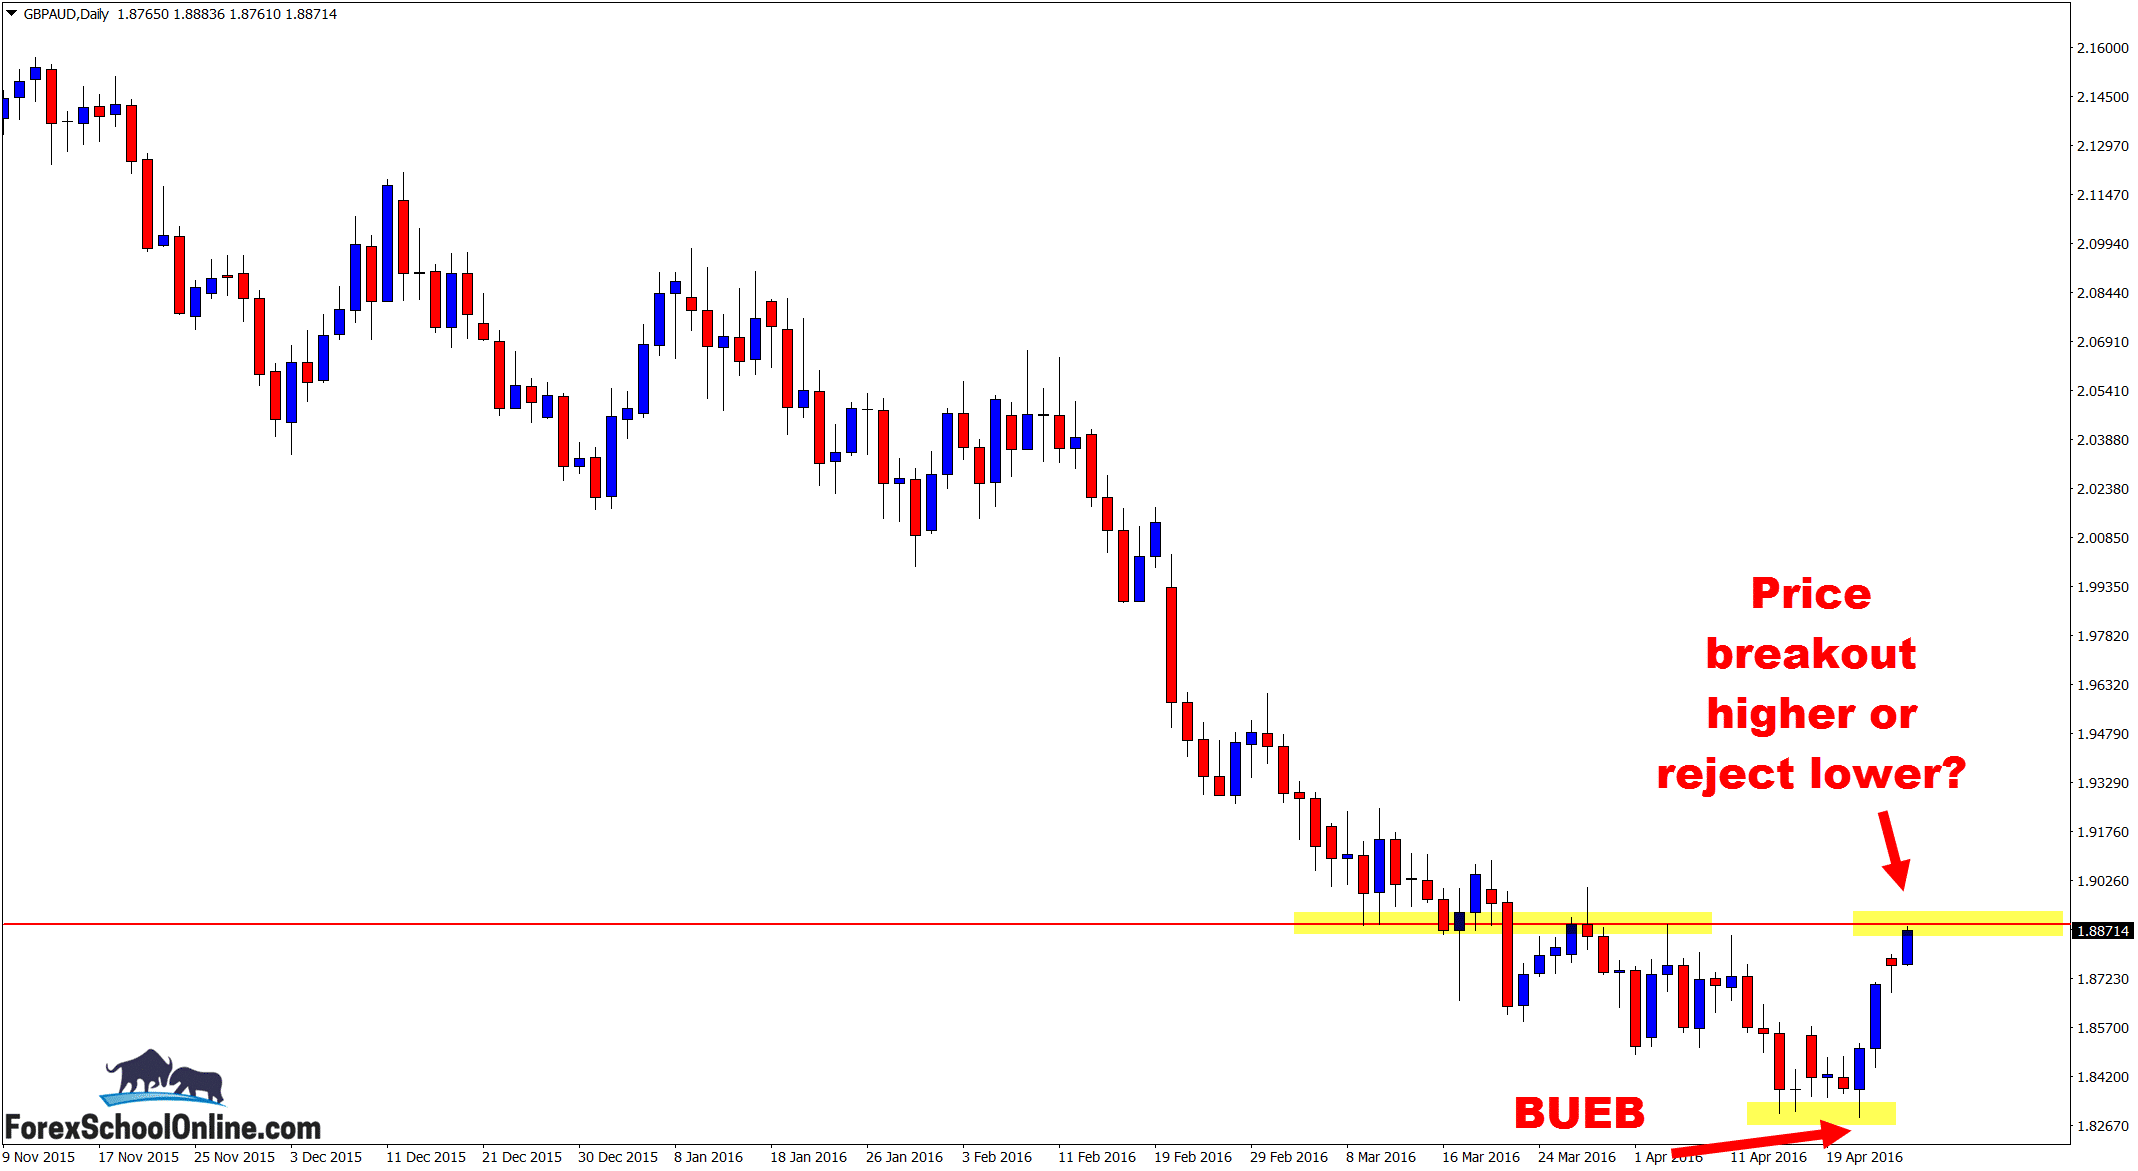
GBPAUD Daily Chart
After moving down to the extreme swing low, price rebounded back higher on the back of a Bullish Engulfing Bar = BUEB. After breaking the BUEB high and moving back higher price has, like the other GBP pairs, moved into the major resistance level.
Inside the lesson The First Test of Support or Resistance Price Action Strategy I go into a strategy for how you can look to get into high probability trades when price quickly breaks out of levels and you then look to enter on the re-test.
For example, if price were to break out higher here, you would then look to get long if price quickly snapped back lower into the old resistance and new support price flip level.
Daily Chart


Hi Osama,
Bullish Engulfing Bar = BUEB.
Good work ! on the last chart you mentioned BUEB word, what does that suppose to mean ?