GBP/JPY Price Prediction – May 2
The market levels between 152 and 149 have now been majorly marked as the GBP/JPY values are over time being featuring to represent a kind of sideway trend currently.
GBP/JPY Market
Key Levels:
Resistance levels: 153, 154, 155
Support levels: 149, 148, 147
GBP/JPY – Daily Chart
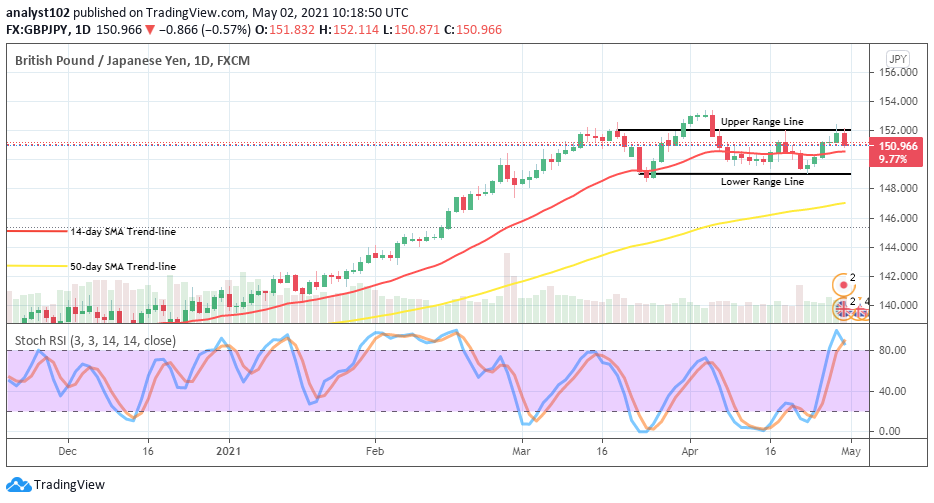
The GBP/JPY daily trading chart has now to some extent shown that the currency pair trading outlook is in a kind of range-moving mood. The upper range line is located at 152 level and the lower range line is situated at 149 points. The 14-day SMA trend-line is in between the range trading lines over the 50-day SMA indicator that is located around 147 point. The Stochastic Oscillators have penetrated the overbought region to close the hairs within it. That signifies the possibility of getting to see small downward pushes within the range trading zones in a near session. Will there still a keep of range-bound moves in the GBP/JPY market?
It seems to have been brought to the limelight that the GBP/JPY will have to maintain a kind of range-bound trading situation in the next sessions. However, the end of each range trading line will be instrumental in determining an eventual change of market trend during either breaking out or breaking down at either of the two lines afterward. However, a quick reversal at the 152 level could once again lead to losing the momentum to a sell-off condition.
As regards analyzing the downside of this currency pair market, in the long run, bears have had the brighter chance to keep resisting any further upswing attempted by the GBP/JPY bulls at a major point between 152 and 154 levels. A retest of those areas during an upward move will give a better clue of a selling moment in the market. Meanwhile, a breakdown of the lower range line may not sustain the test of time as it could potentially turn out fake.
In summary, the market valuation of GBP/JPY still has the stronger indication of bullish trend continuity especially, while price tends to make a reverse devoid of a forceful breakdown of the 149 lower range line. GBP/JPY 4-hour Chart
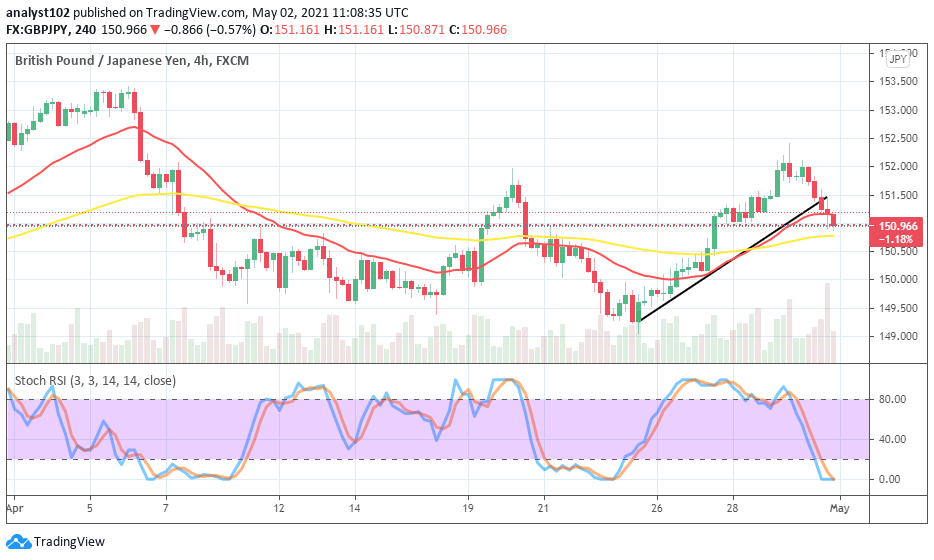
Presently, there is a price correctional move in the medium-term market valuation of GBP/JPY. The trend still appears in a bullish trading outlook despite the moving rate of the retracement. Both the bullish trend-line drew and the 14-day SMA trend-line are being beached to the south. The Stochastic Oscillators are located closer below them. The Stochastic Oscillators are dipped into the oversold region to close the hairs. That signifies that the downward pressures may soon come to an end to allow the base currency to regain the catalyst to re-launch its stance back into the market.
Note: Forexschoolonline.com is not a financial advisor. Do your research before investing your funds in any financial asset or presented product or event. We are not responsible for your investing results.
Learn to Trade Forex Online
GBP/JPY Price Rises and Falls Around the Levels of 152 and 149
Footer

ForexSchoolOnline.com helps individual traders learn how to trade the Forex market
WARNING: The content on this site should not be considered investment advice and we are not authorised to provide investment advice. Nothing on this website is an endorsement or recommendation of a particular trading strategy or investment decision. The information on this website is general in nature so you must consider the information in light of your objectives, financial situation and needs.
Investing is speculative. When investing your capital is at risk. This site is not intended for use in jurisdictions in which the trading or investments described are prohibited and should only be used by such persons and in such ways as are legally permitted. Your investment may not qualify for investor protection in your country or state of residence, so please conduct your own due diligence or obtain advice where necessary. This website is free for you to use but we may receive a commission from the companies we feature on this site.
We Introduce people to the world of currency trading. and provide educational content to help them learn how to become profitable traders. we're also a community of traders that support each other on our daily trading journey
Forexschoolonline.com is not a financial advisor. Do your research before investing your funds in any financial asset or presented product or event. We are not responsible for your investing results.

Leave a Reply