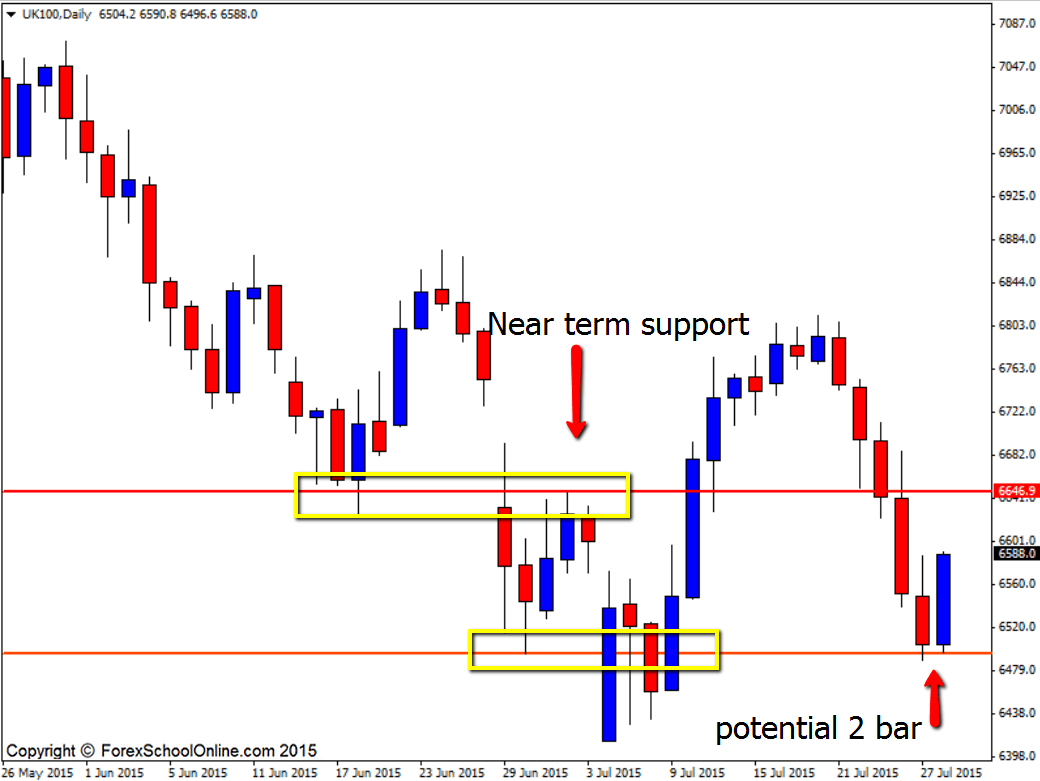
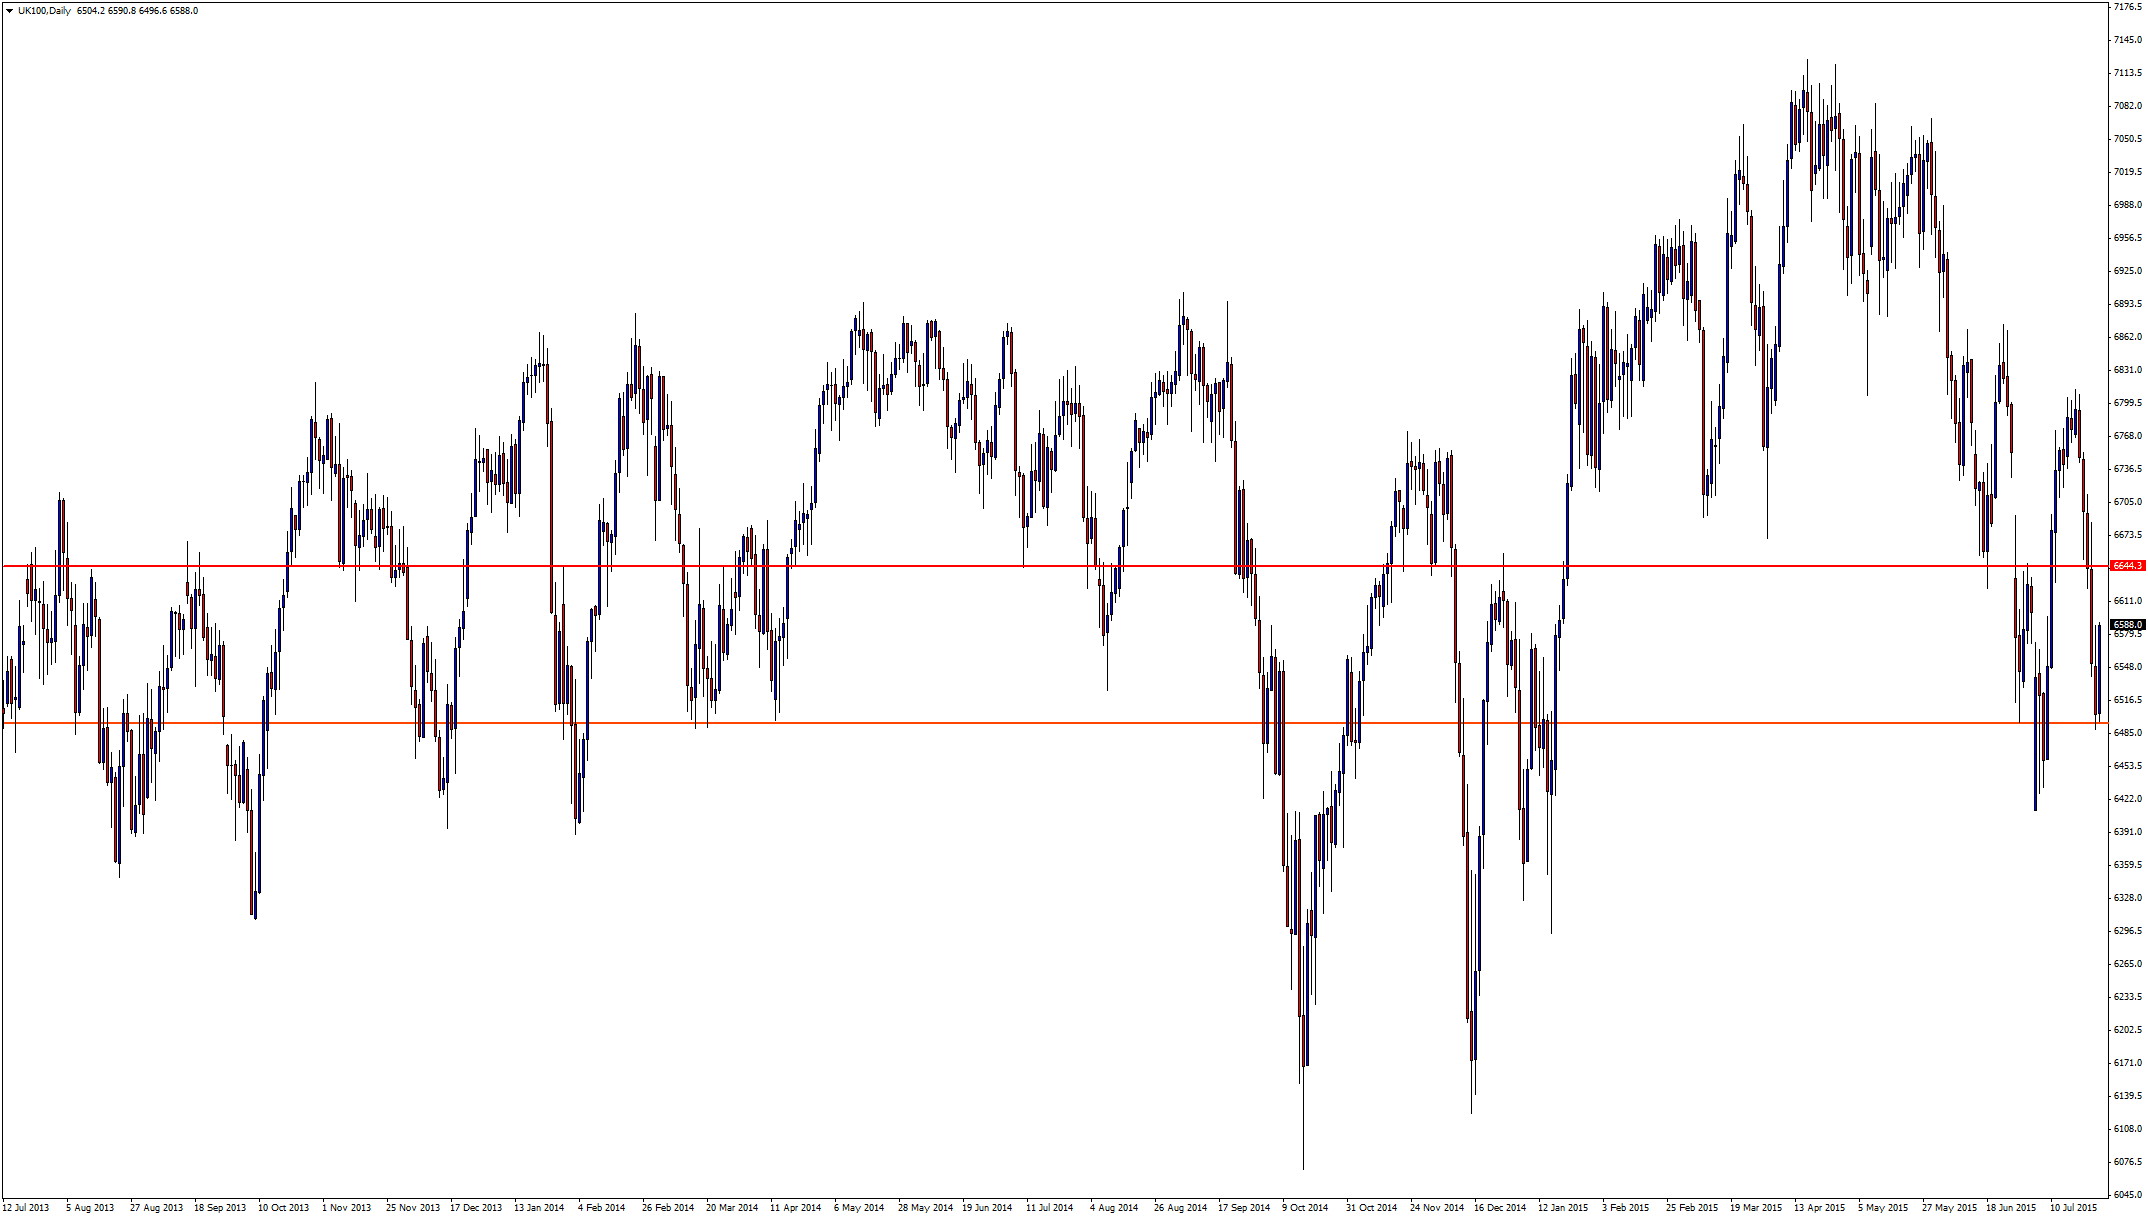
The UK 100 or what is better known around the world as the FTSE is rejecting a major daily demand level with price potentially forming a bullish 2 bar reversal in the process. Price has been caught in very sideways trading of late in this market and whilst in the very recent times price has made some strong moves lower, if we look at the overall movement from left to right we can clearly see that there is no obvious trend and that price is in a choppy sideways phase at the moment.
Trades are fine to be played in ranges/consolidations or choppy markets as long as you identify that, that’s exactly the type of market that price is trading in and you manage your trade accordingly.
As price began to move into the major daily support/demand area you could have started to look for bullish trade setups on both your higher and intraday charts. Now that price is looking to potentially reject and move higher, you can keep a close eye on the daily chart – to see if the 2 bar reversal does eventuate and if it does – if the trade can be entered safely in a way that allows you to make sure the trade is high reward with very little risk.
If price can continue higher from here, the next major resistance on the horizon comes in around the 6646.900 area where as you can see on the zoomed out chart below; there is a major level that goes back a long way previously as a key price flip that is proven as both a support and resistance.
MAJOR IMPORTANT NOTE: Become a FREE *VIP* Class Member and receive behind closed door teachings not shown to the public! Sign up to become a student here;
Daily Chart

Daily Chart – Zoomed Out


Leave a Reply