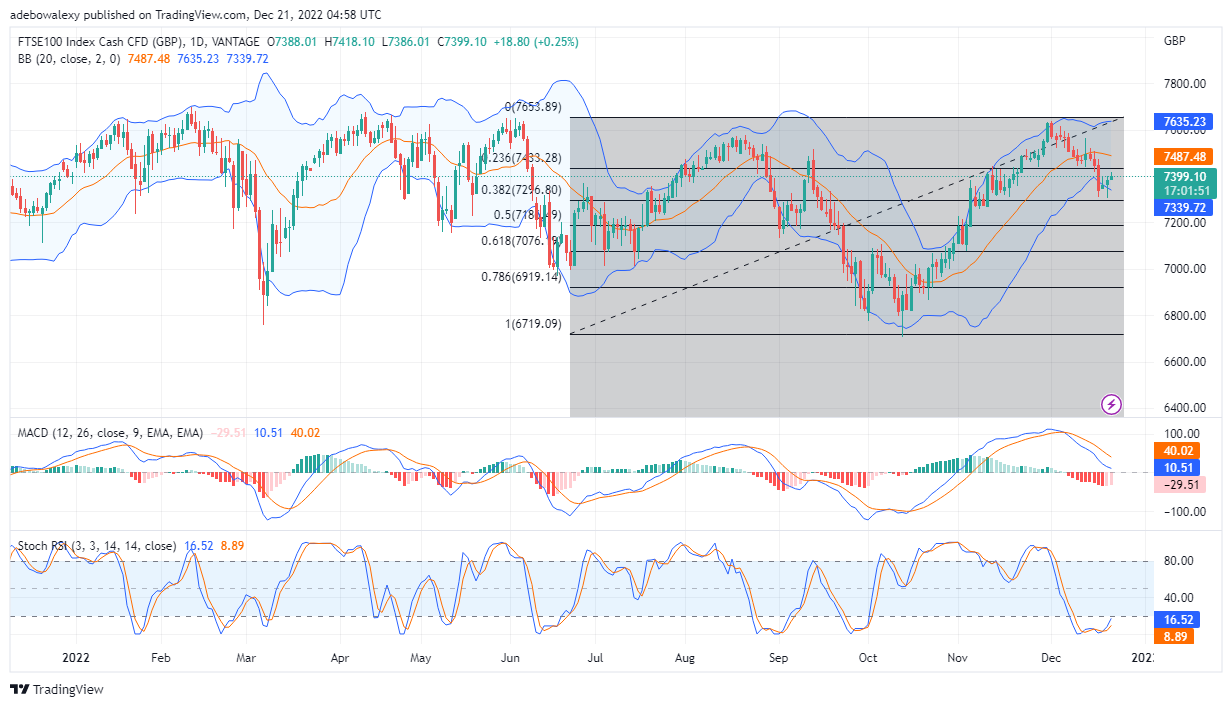
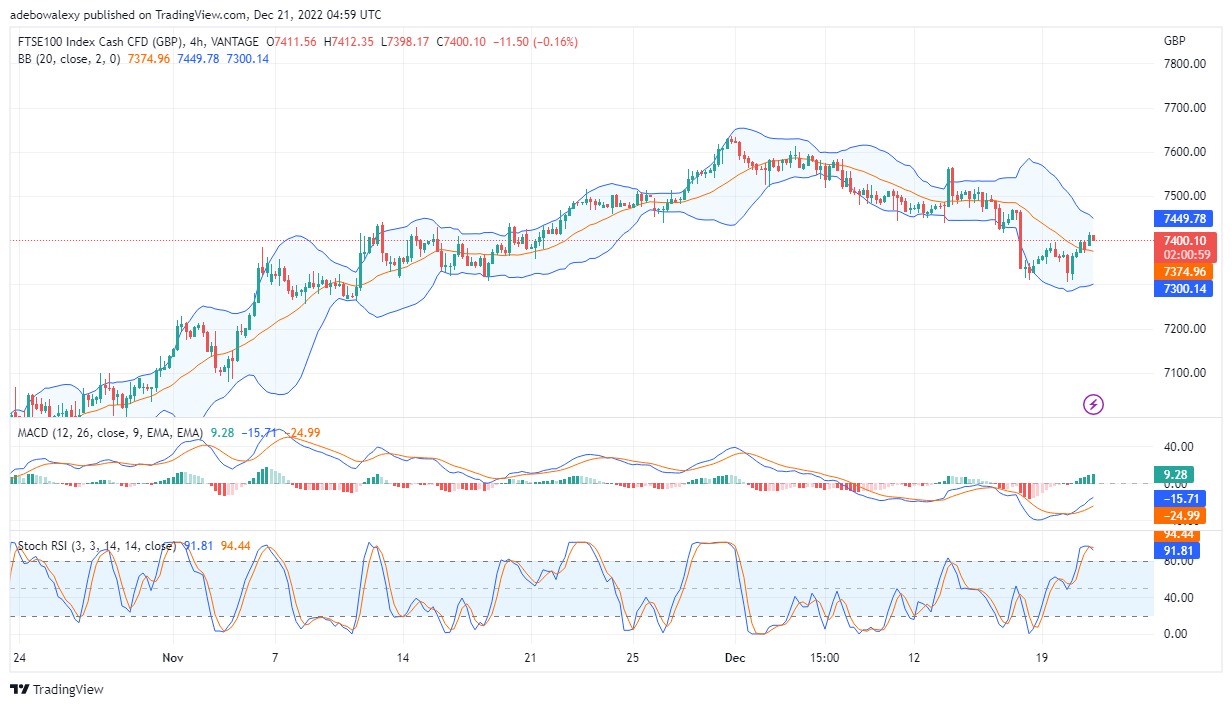
As FTSE 100 price poked through the 7,600 level, selling pressure grew strong, and price action was pushed to 7,330, from 7,633. Currently, FTSE 100 price has risen to 7,399, and we may see more increase as trading continues.
Important price Levels:
Top Levels: £7,399, £7,430, £7,550
Floor Levels: £7,350, £7,330, £7,300

FTSE 100 Eyes 7,433 Price level
Following the minimal gains recorded in the FTSE 100 daily market, indications coming from trading indicators seem to tell that price is aiming at breaking the resistance of £7,433 shortly. The lines of the RSI indicator can be seen taking an upward path from the oversold. Also, the MACD too has been picking up signs of increased buying. This can be read from the indicator, as the histogram bar below the equilibrium level is now turning pale – pointing to a decrease in bearish momentum. Also, it could be seen that for the last three trading sessions buyer has retained control over price action. Going by signs from trading indicators, traders can predict price moving towards the above-said level.

FTSE 100 Upside Hopes Stays On
Price activities on the FTSE 100 4 – hour market seems to have arrived above promising support. Over the past two trading sessions, market activities have been occurring above the Moving Average curve. Additionally, trading indicators are still showing signs that prices may still increase. Despite, the predominant selling in this session, the MACD indicator continues to show that buying pressure is still significant. However, a bit on the contrary, although the lines of the RSI have risen into the overbought, it has displayed a bearish crossover. Consequently, we can say this is portraying the last bearish price candle. Nevertheless, since this line remains in the overbought, the MACD lines are still pointing upwards, and price action is now above the MA line, traders can predict with caution, that FTSE price may break the £7,433 upwards.
Do you want to take your trading to the next level? Join the best platform for that here.


Leave a Reply