For traders who like trading high probability price action setups with the strong trend and from key levels, there are a lot of Forex pairs moving into key levels and kill zones about to set up for potential A+ high probability trades. One example of a potential move into a key level to hunt for a trade if price can move higher is the CADCHF.
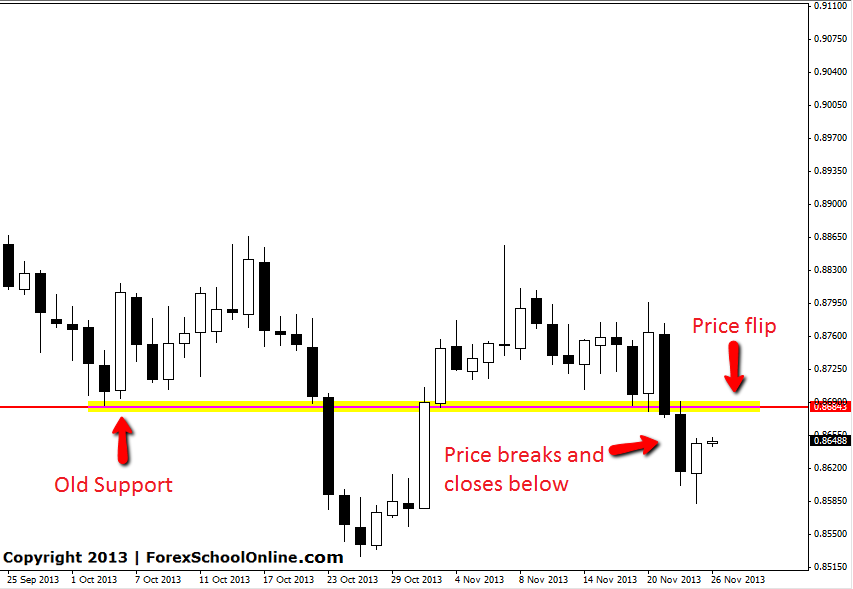
Price on the daily chart of the CADCHF has broken through and closed below a support level. This level has broken and could now look to act as a price flip level. If price moves back into this area it could now look to act as a new resistance area and a very solid area to hunt for short trades. This new key resistance level also lines up with the 50% Fibonacci level.
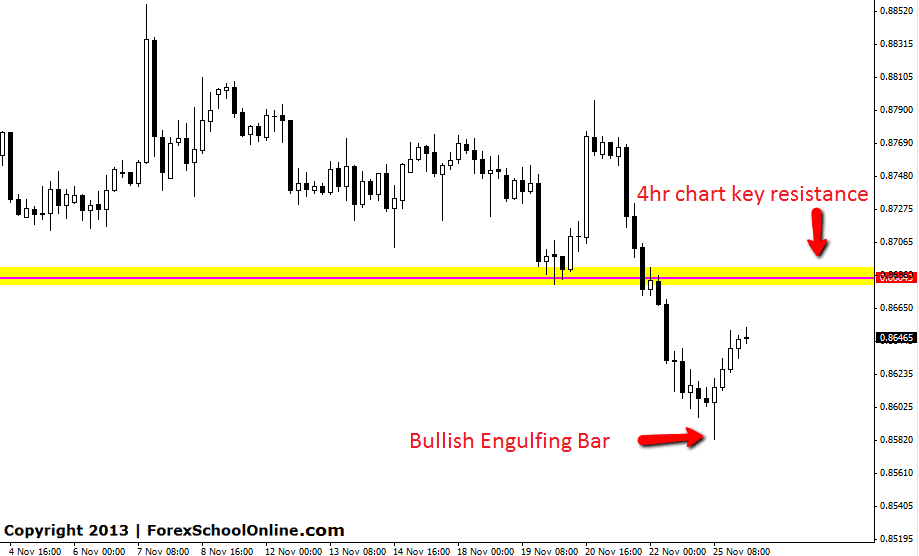
The best time frames to look for trades on this chart could be the 4hr & 8hr charts or even the 1hr chart. Looking for trades on these intraday charts would mean traders would be taking trades with the trend on their side. The 4hr chart below shows how price made a Bullish Engulfing Bar (BUEB) on the 4hr chart that set this move off higher.
There are plenty of other Forex pairs with similar patterns setting up such as the AUDCHF, AUDUSD, AUDCAD plus others, but it is very important for any trade to be confirmed a high probability price action setup would have to form such as the ones we teach in the Forex School Online Price Action Courses. If price simply breaks through and continues moving through these levels without any high probability signals then the levels will be broken and they will then become new support levels again.
CADCHF Daily Chart


great setup, but i already entered it since the very large pinbar and still hold it