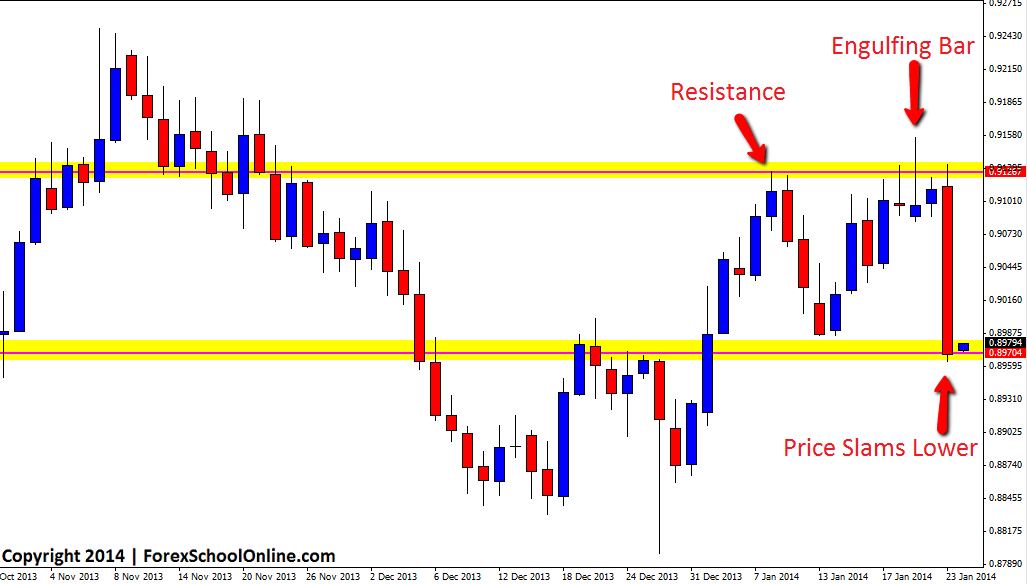
The daily price action charts of the Forex market have seen some substantial breakouts and big movements over the last 24 hours with price on a lot of pairs making major moves in line with their overall trends or key price action. The recent price action we discussed in this blog on the USDCHF daily chart has now seen a large move lower with price collapsing on the daily chart to now be just below the Very Big Round Number of 0.9000.
Price had formed a Bearish Engulfing Bar/Pin Bar combo that was making a false break of the recent swing high resistance area. To read the recent post of this analysis see here: USDCHF Makes False Break on Daily Price Action Chart. Price formed an inside bar and wound up before confirming the price action with a break lower. Once price did confirm with this break lower it set off an avalanche of orders which sent price crashing into the next support level.
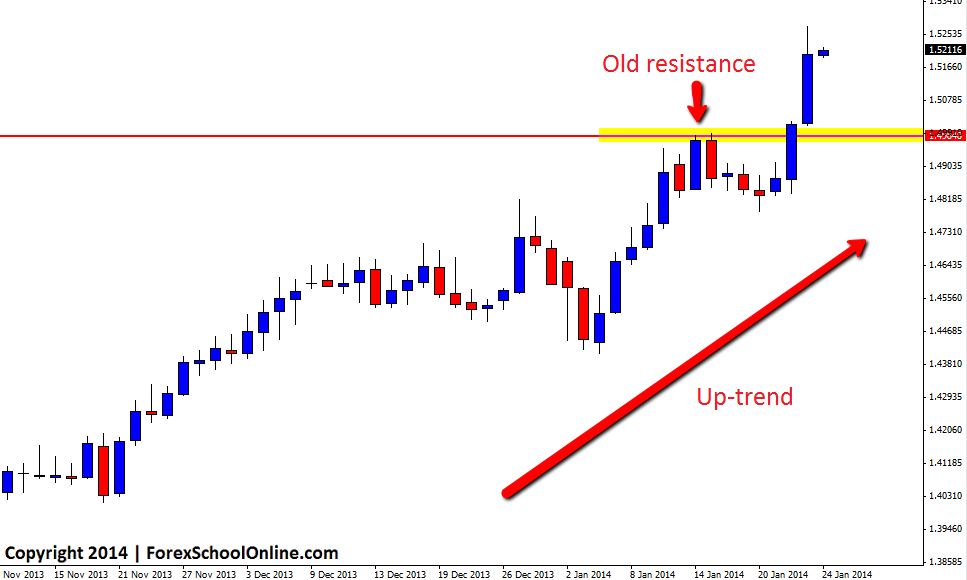
Similar movements such as this on the USDCHF daily chart can be seen on many other pairs such as the EURCAD and CHFSGD. The EURCAD has exploded higher on the daily price action chart. Price had been in a period of consolidation however it has now broken out inline with the clear up-trend. Traders who like to trade with the trend could now start to look for long trades should price make any rotations back lower and into value areas.
USDCHF Daily Chart

EURCAD Daily Chart


Leave a Reply