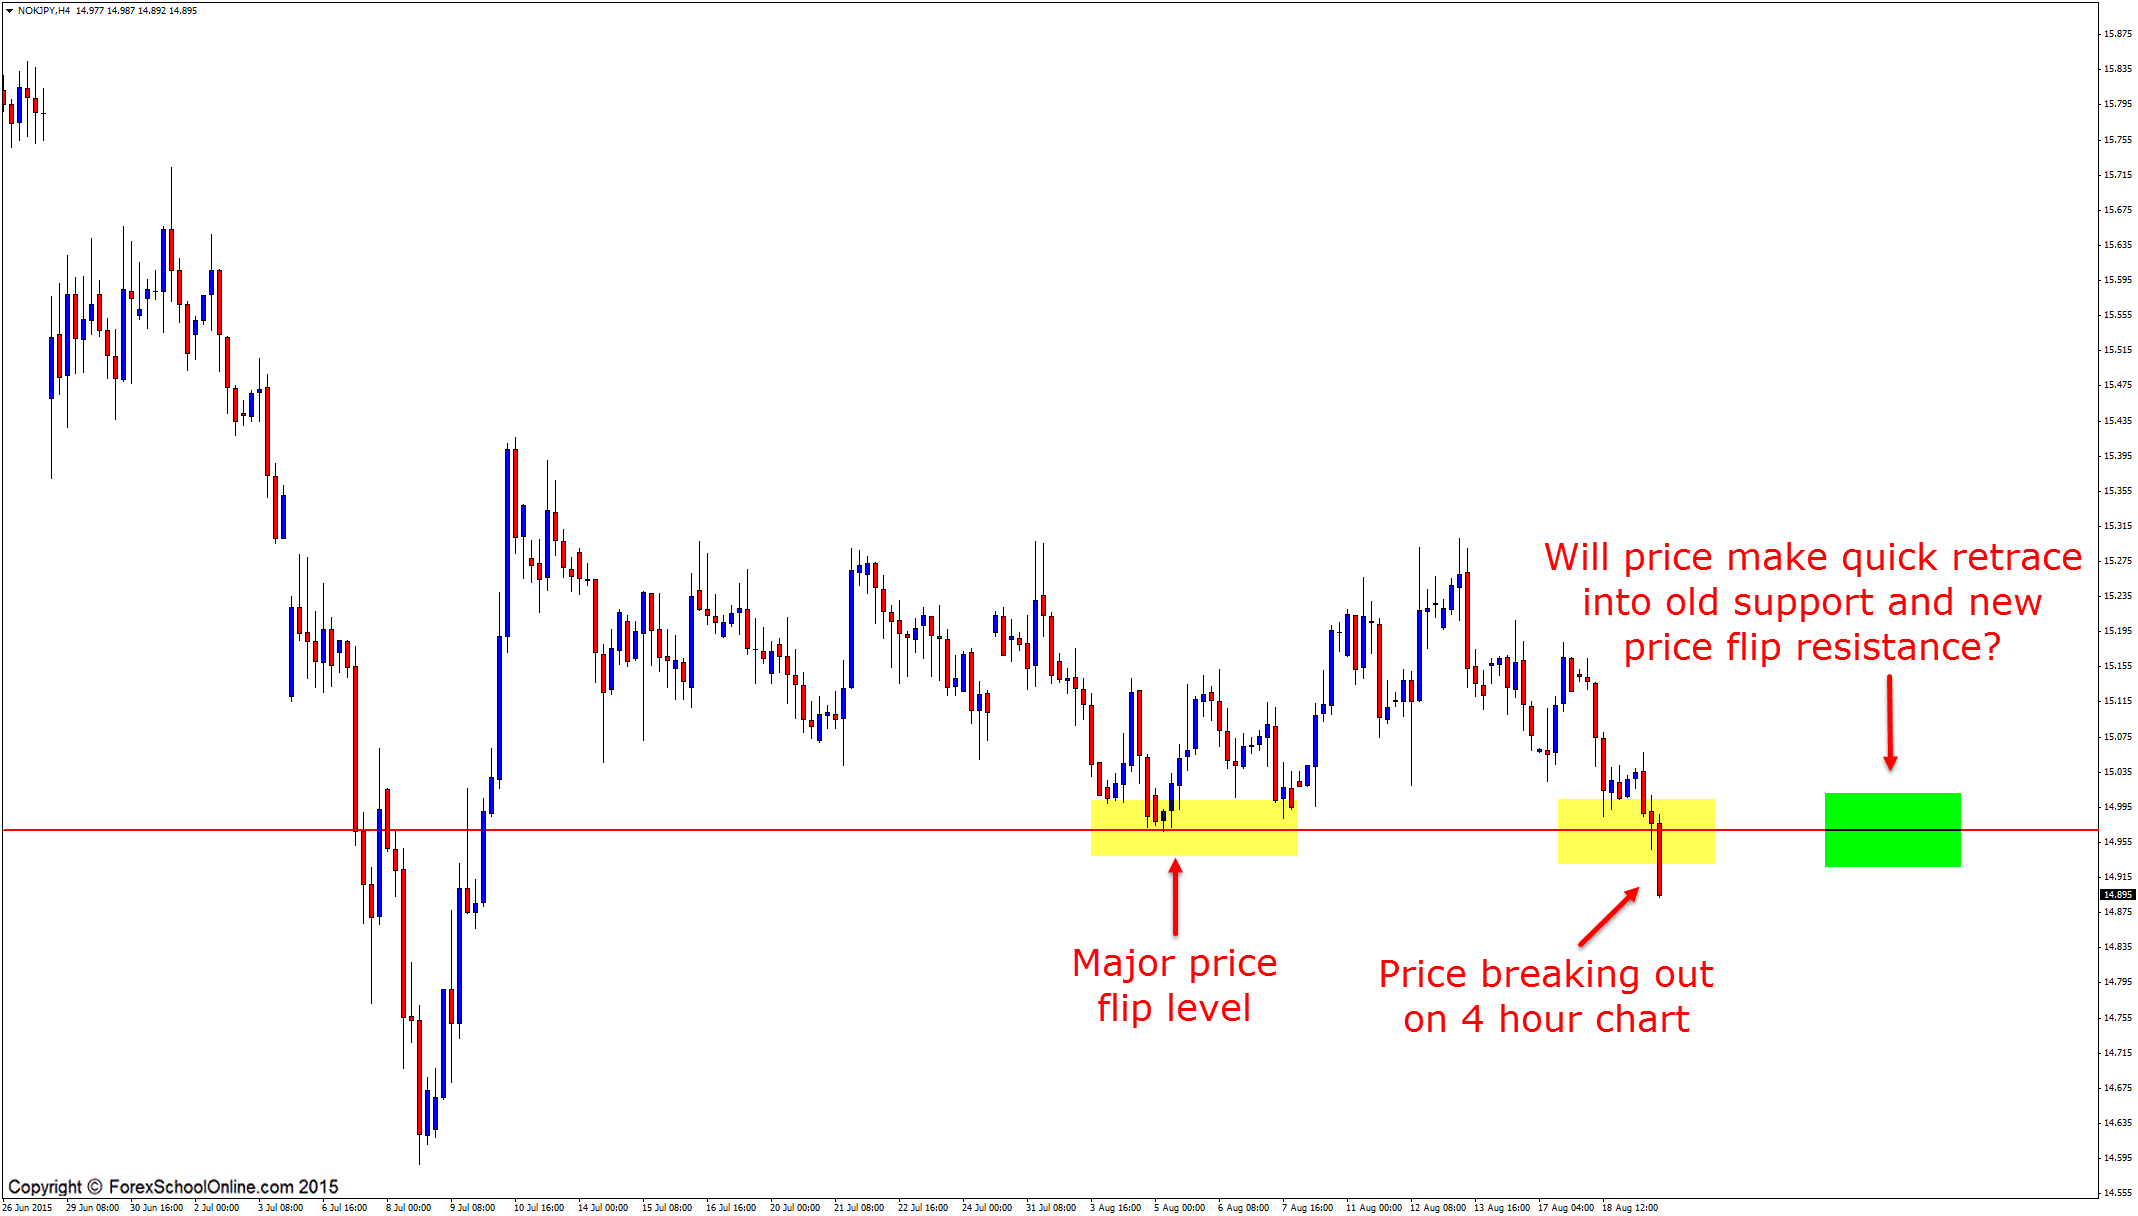
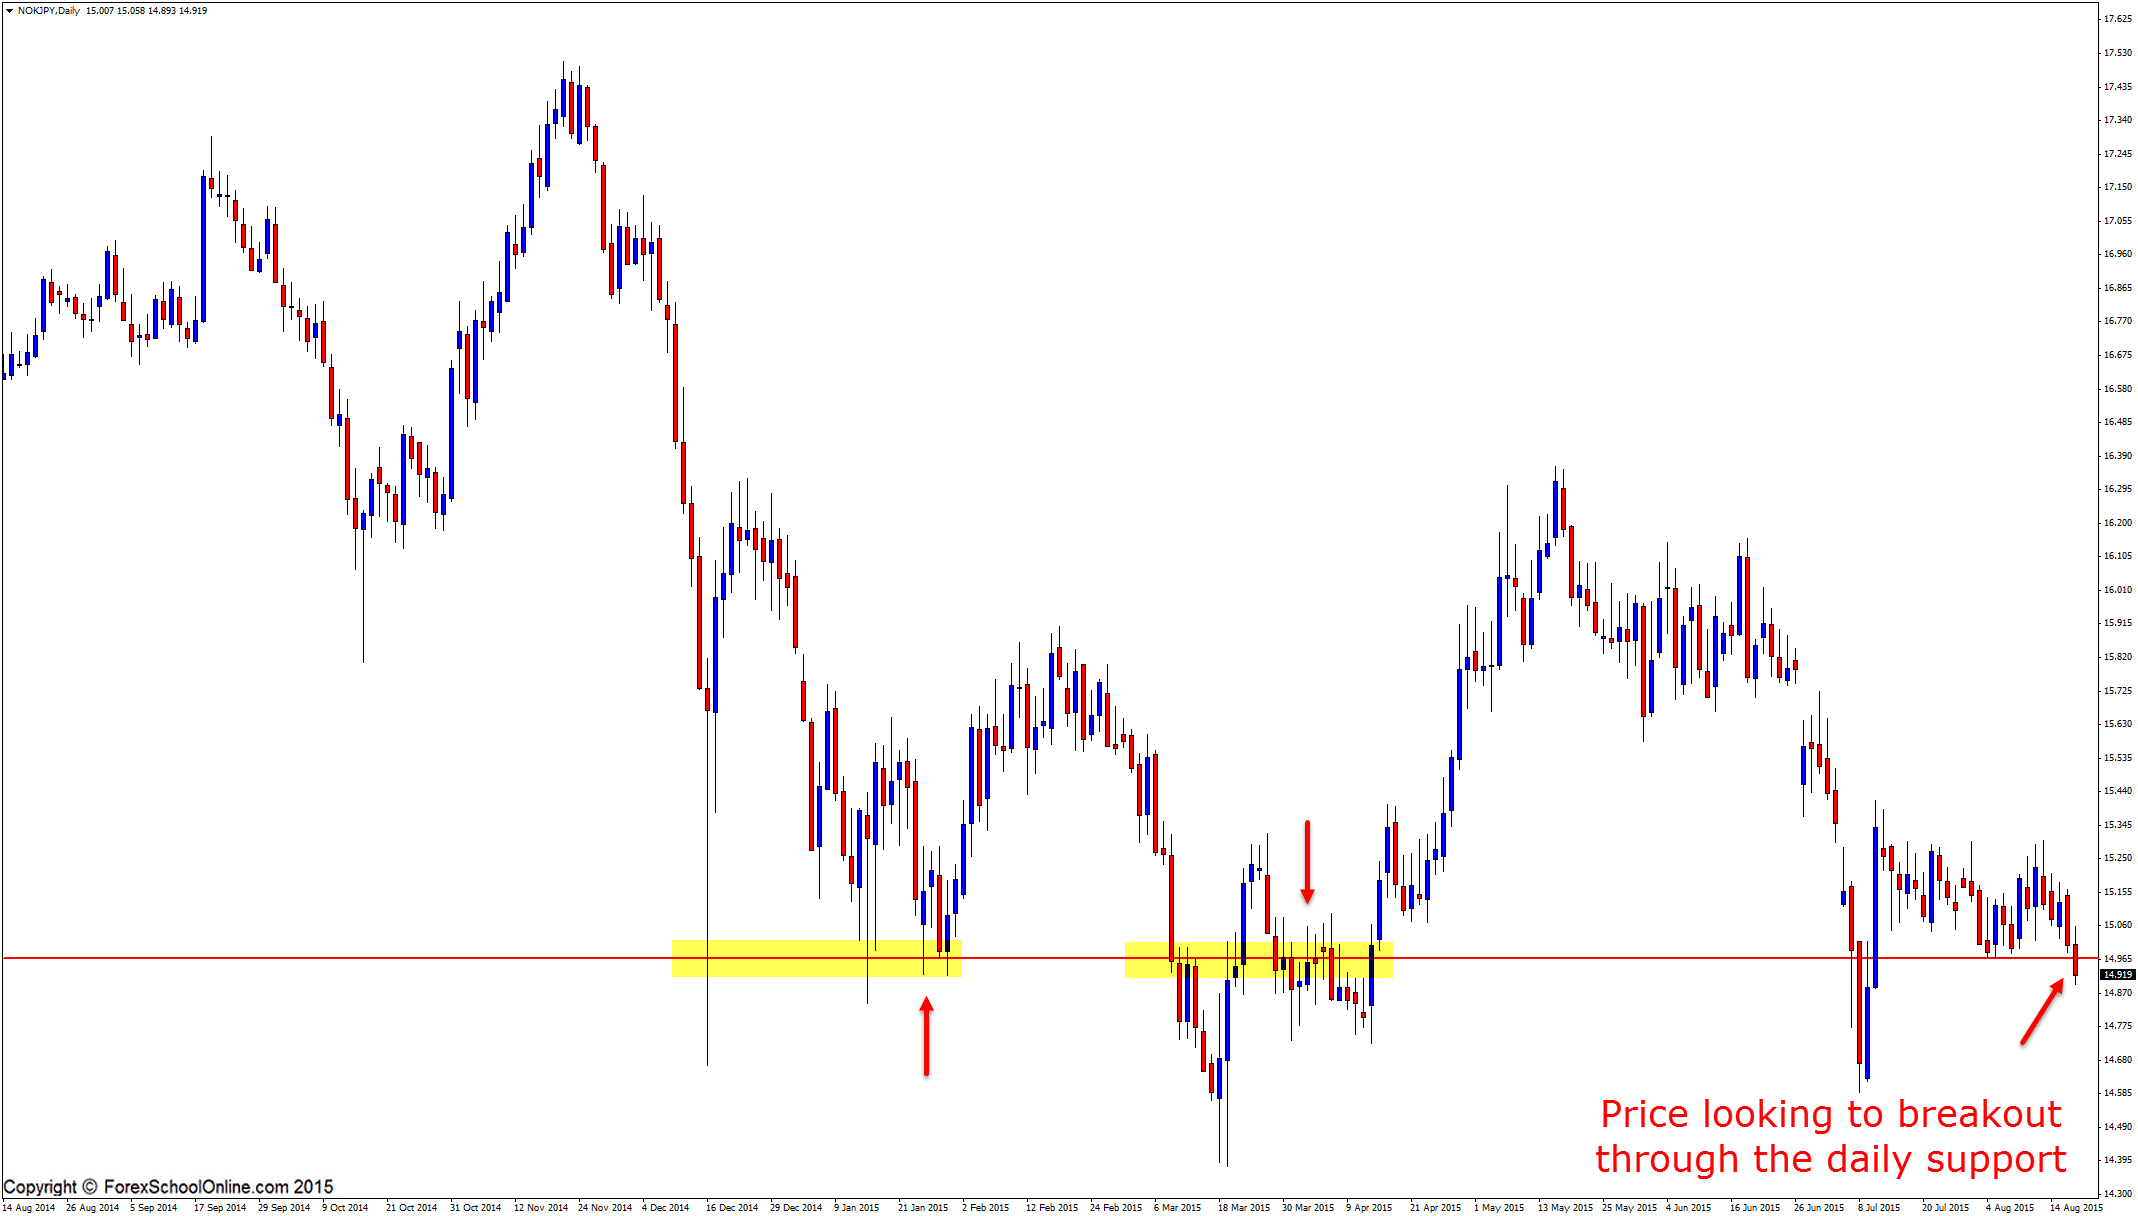
Price is, as I write this, making a strong attempt to break the major daily support level of the more exotic pair; the NOKJPY. This support level is both a longer term and short term support level that has proved to be a super important level in this market with price really struggling to move and close below it. As I often discuss in this blog, it is the close, either above or below, that is the crucial point to note and that is exactly what we will be watching out closely here again today in this market.
Whilst this pair is a more exotic pair, it is a Forex pair that is still viable to be traded and it meets the 3 main criteria I often talk about that needs to be met for me to consider trading it, which are:
- There are not gaps all over the charts like some markets or Forex pairs have.
- The spread is not out of control.
- It respects it’s levels and is an overall good looking market (see bigger explanation below).
If the spread is so large on a pair or market that I am going to be entering, (and before even getting into the trade, I am so far behind that it makes it hard to even get back to break even), then I am going to just give that pair a miss and move onto the next trade. The same goes for a market that is not respecting key levels and it is just one big mess.
If the price on an exotic pair is a big choppy sideways mess, if there are a lot of big candle wicks on the candle ends and price is not making many extended moves – in other words, if there are not many solid moves either higher or lower where price has made runs and profit-making trades could have been made, then I will give this market a miss.
The NOKJPY is a solid pair to watch and trade; however, I have discussed it in this blog a few times. If you are trading it with a broker, such as one of the ones we recommend, then you will be getting really decent spreads, which will also make trading these types of pairs a lot more profitable.
As the daily and 4 hour charts I have attached below show, price has moved below the major price flip level. If price can hold below this level, it could present with the potential for you to hunt for high probability short trades over the coming sessions.
Should price rotate back higher and back into the old support and new price flip resistance, you could watch the price action behavior and look for potential bearish trigger signals to get short at the old breakout area. You could look for these bearish trigger signals on the intraday time frames, such as the 4 hour, 1 hour, or potential lower time frames, depending on the time frames you are comfortable on. I highly recommend you read the trading lesson on trading price action on different time frames here:
Trading High Probability Price Action From the Daily Charts Down to the 15 Minute Charts
Daily Charts
4 Hour Charts

Related Forex Trading Education
– Trading High Probability Price Action From the Daily Charts Down to the 15 Minute Charts


Leave a Reply