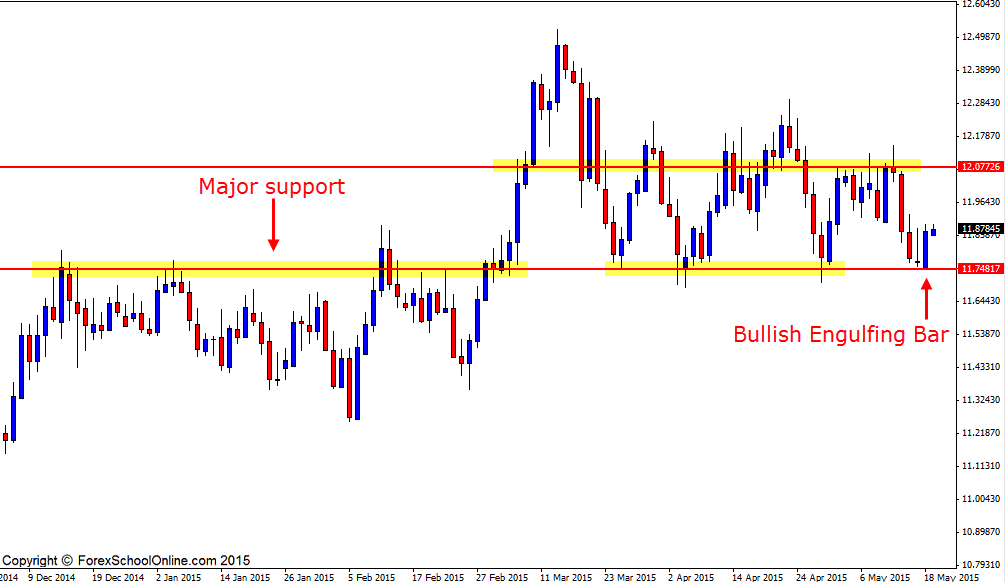
The USDZAR (US Dollar v South African Rand) has fired off a bullish engulfing bar (BUEB) on the daily price action chart at a major daily support level. This chart has been super choppy of late and as the daily chart shows below; this engulfing bar does have a minor trouble area or minor resistance straight overhead to try and break through.
Just previous to forming this Bullish Engulfing Bar, price formed an inverted pin bar or a pin bar that is formed pointing the wrong way. Normally when I discuss these it is to highlight pin bars that traders need to be wary of and careful that they don’t get sucked into playing, but we can still use them for information.
These inverted pin bars can often hint at price being exhausted or price looking to make a move in the opposite direction and are the exact opposite to what the normal pin bar is looking to do. I discuss the super common price action that sucks traders in, in this trading lesson here;
The Price Action You Need to be Super Wary of
If price can break higher and above the minor trouble areas as discussed above, then there looks to be space to break into. The tricky thing for this market is the recent consolidation and sideways trading and making sure that when trading in these sorts of markets you always keep it in mind and manage the trade accordingly, you do not manage it like a big trend trade. This is exactly how we teach our advanced members in the Forex School Online Price Action Courses to manage their trades in different market types.
USDZAR Daily Chart
Related Forex Trading Education
– The Exact Markets & Forex Pairs Johnathon Fox Trades & Why


Leave a Reply