A lot of traders have a trading method where they focus on only a handful of Forex pairs and time frames. They concentrate all of their energy and time into finding trade setups for these few pairs. This can be a very solid method and way of going about things if it’s forming a lot of setups.
Where the problem can come in really quickly however is if the trader is using a method that does not form lots of trades. Often this can lead to the trader watching the same few pairs over and over and forcing the market, finding setups where there are none just because they want to be in the market.
To counter this, I use the “Cherry Picking” method, which means taking the best fruit from a wide range of different trees. Instead of forcing trades from a few markets, I look to take the best A+ trades from a wide range of different markets. I go into this in the trade lesson:
How to Cherry Pick the Very Best Trade Setups – The Markets I Look to Trade
These markets include the cross Forex pairs, other markets like Oil and pairs like today’s one: the EURNOK.
There are some pairs and markets that I do not trade, and as you will read in that lesson there are criteria. Some markets are too choppy, they do not respect their support or resistance levels at all and to make a trade would not be worth it because of the cost of the spread to enter. But this market whilst in a range at the moment has clear daily levels and has space to move into, which is key.
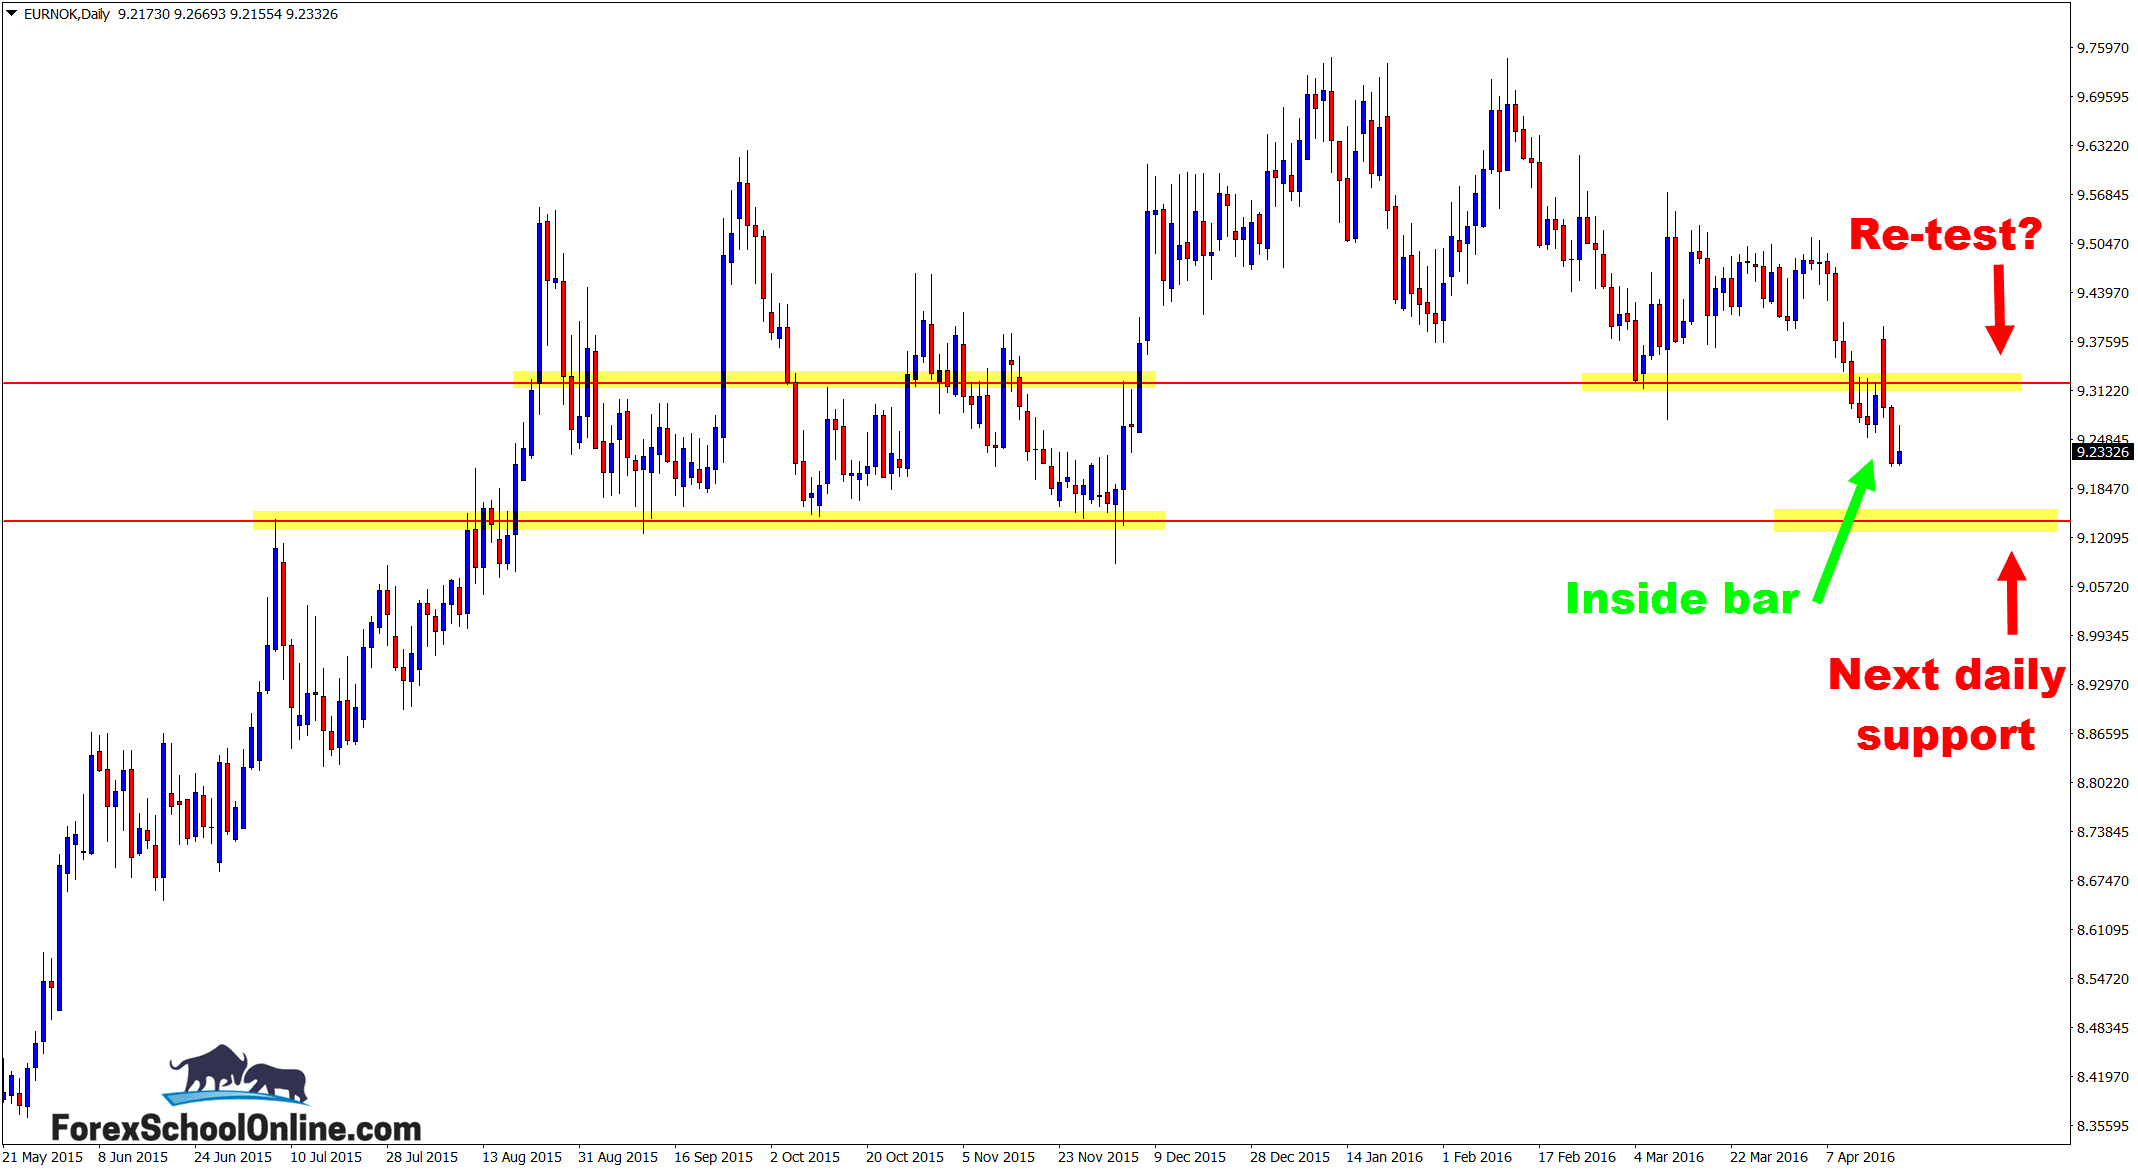
If you look at the daily chart below, you will see that price is currently in-between two major levels. It is this move that could present us with the opportunity. As I have often discussed in the past, when price is in this type of market i.e. trading sideways, the levels are very important and we need to be trading from the highs and the lows, NOT in the middle or no man’s land.
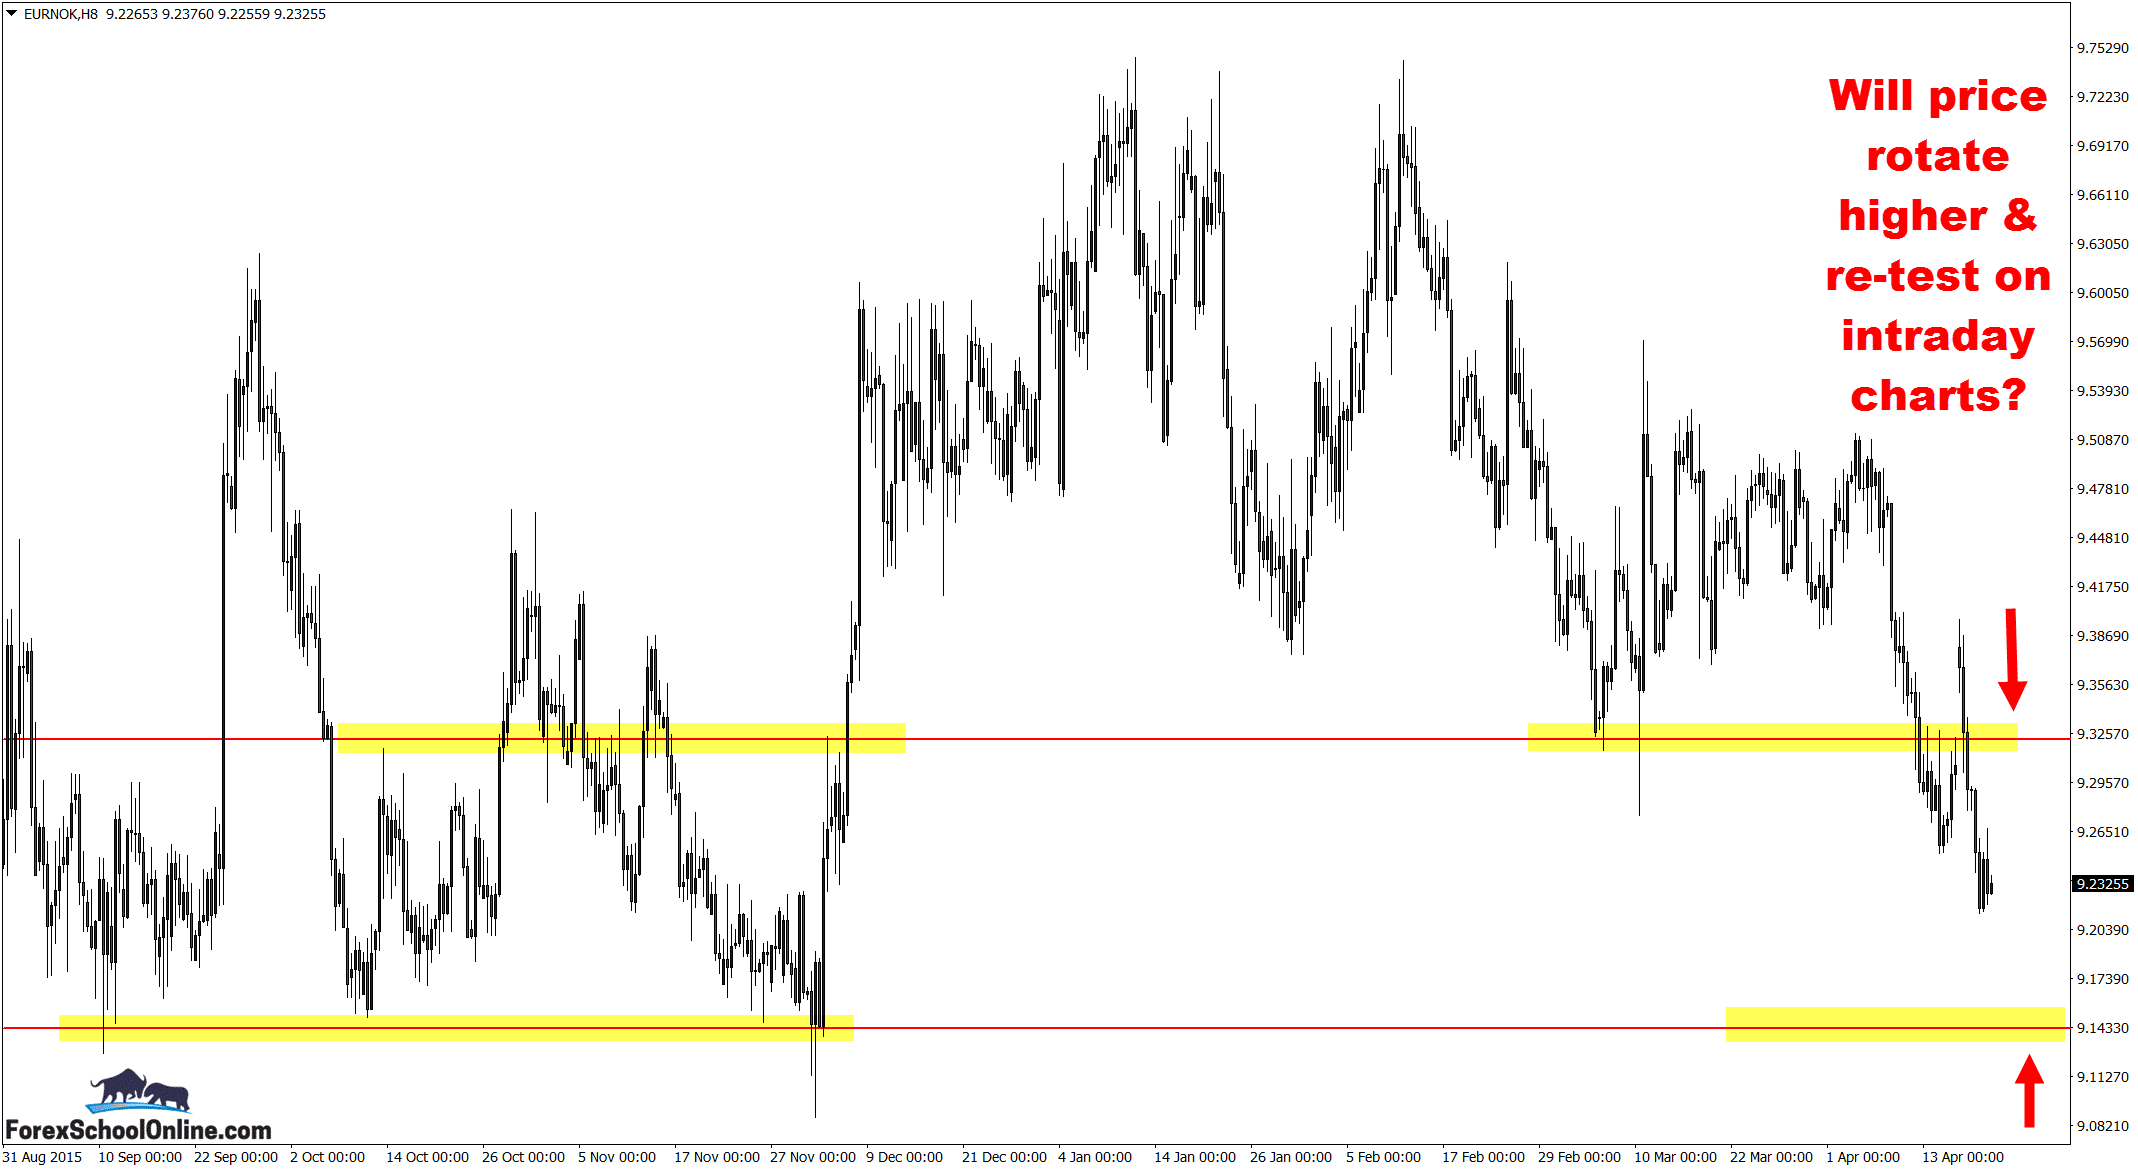
If price makes a retrace back higher, we could watch the price action for potential short opportunities at this major level. The other possibility is if price continues on into the daily support level where price last moved into. The last time price was here it made a false break and smashed higher. See the 8 hour chart below.
If you want to make an 8 hour chart or any other time frame on your MT4 chart like 2 hour, 12 hour, 2 day etc, then get the indicator that will help you make any time frame you want here;
MT4 Time Frame Change Indicator
Daily Chart – Key Levels

8 Hour Chart – Re-test?

Related Forex Trading Education


Leave a Reply