Price action has taken off on the EURUSD, USDJPY & USDCAD daily charts. As you can see below; all of these Forex pairs have broken out of their respective key daily major support or resistance levels with strong breaks and then made strong moves higher or lower.
EURUSD DAILY CHART
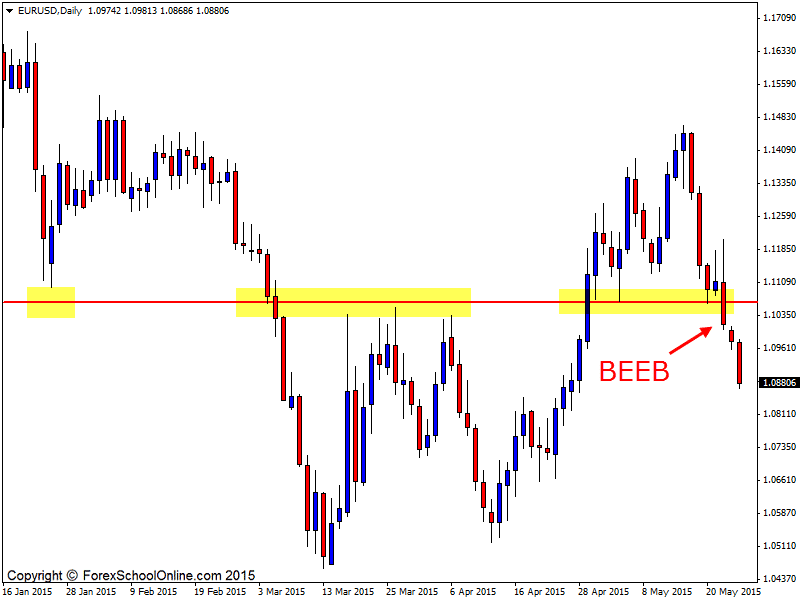
The EURUSD formed a strong Bearish Engulfing Bar (BEEB) that closed below the major daily support level. This BEEB was a clear indication that price was making a move below the daily price flip level.
The important things to note about this BEEB are how it started above the support level and then finished well below it. Also take note of how price closed so strongly towards the engulfing bars lows at the end of the session. At the end of the engulfing bar price closed right near the lows indicating the bears were right in control.

USDJPY DAILY CHART
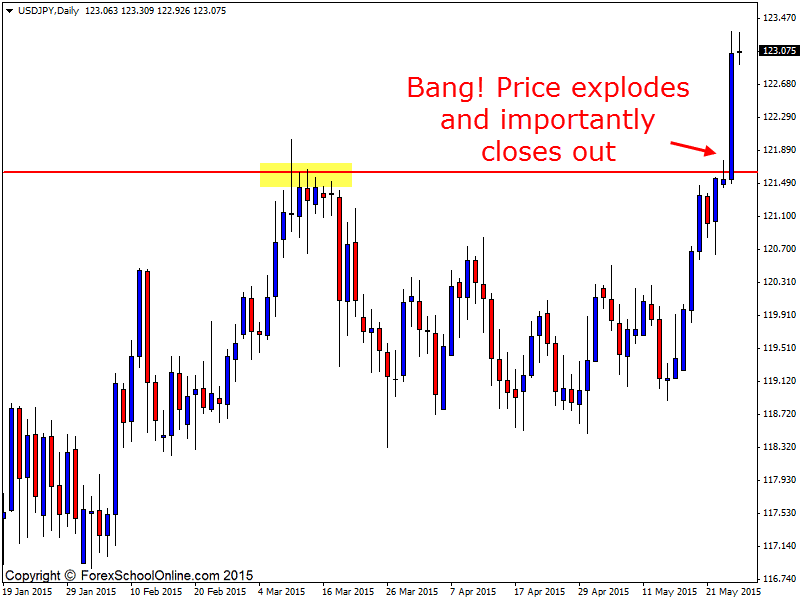
After trading sideways for the past seven months price has finally broken out and made a move. As I often discuss and talk about in here with the sideways and consolidating markets; the longer price stays congested or trading sideways winding up, normally the more explosive the breakout will be and this is a classic example of just that.
As we can see on the daily chart now that price has finally broken out, it has exploded higher with great force and the reason this happens is quite simple.
When price is stuck in a range no one wants to trade it or enter the market. The big guys understand that making money in range bound markets is super tricky and so they stay out, but as soon as price does break out an avalanche of money comes back into play with traders looking to make new trades once again which often causes that huge and aggressive breakout.

USDCAD DAILY CHART
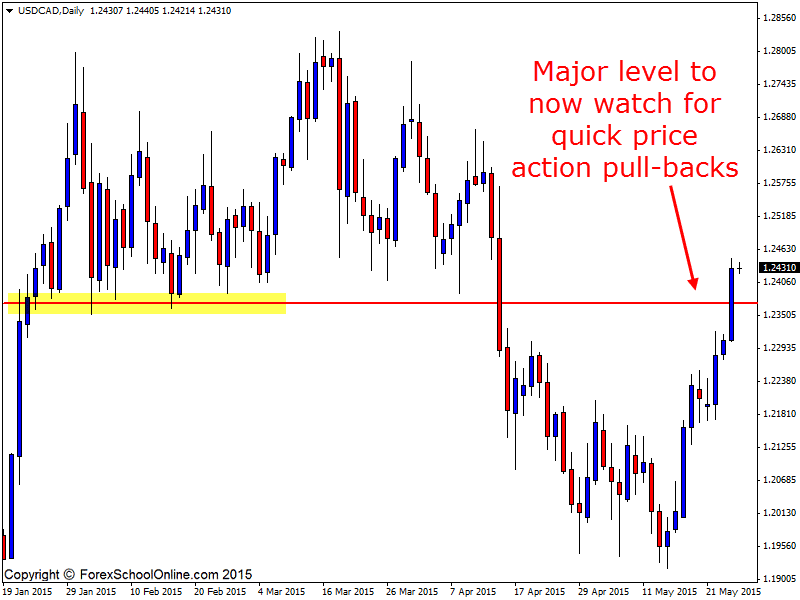
Here on the USDCAD we have the potential for a quick intraday trade if price can make a quick retracement or pullback into the old resistance and potential new support area.
Price has broken higher and through a major resistance area with a strong break. If price now makes a sharp rotation back lower and into the new support area, traders could hunt for long trades on their intraday charts such as their 8/6/4/2 hour or potentially lower time frames.


Leave a Reply