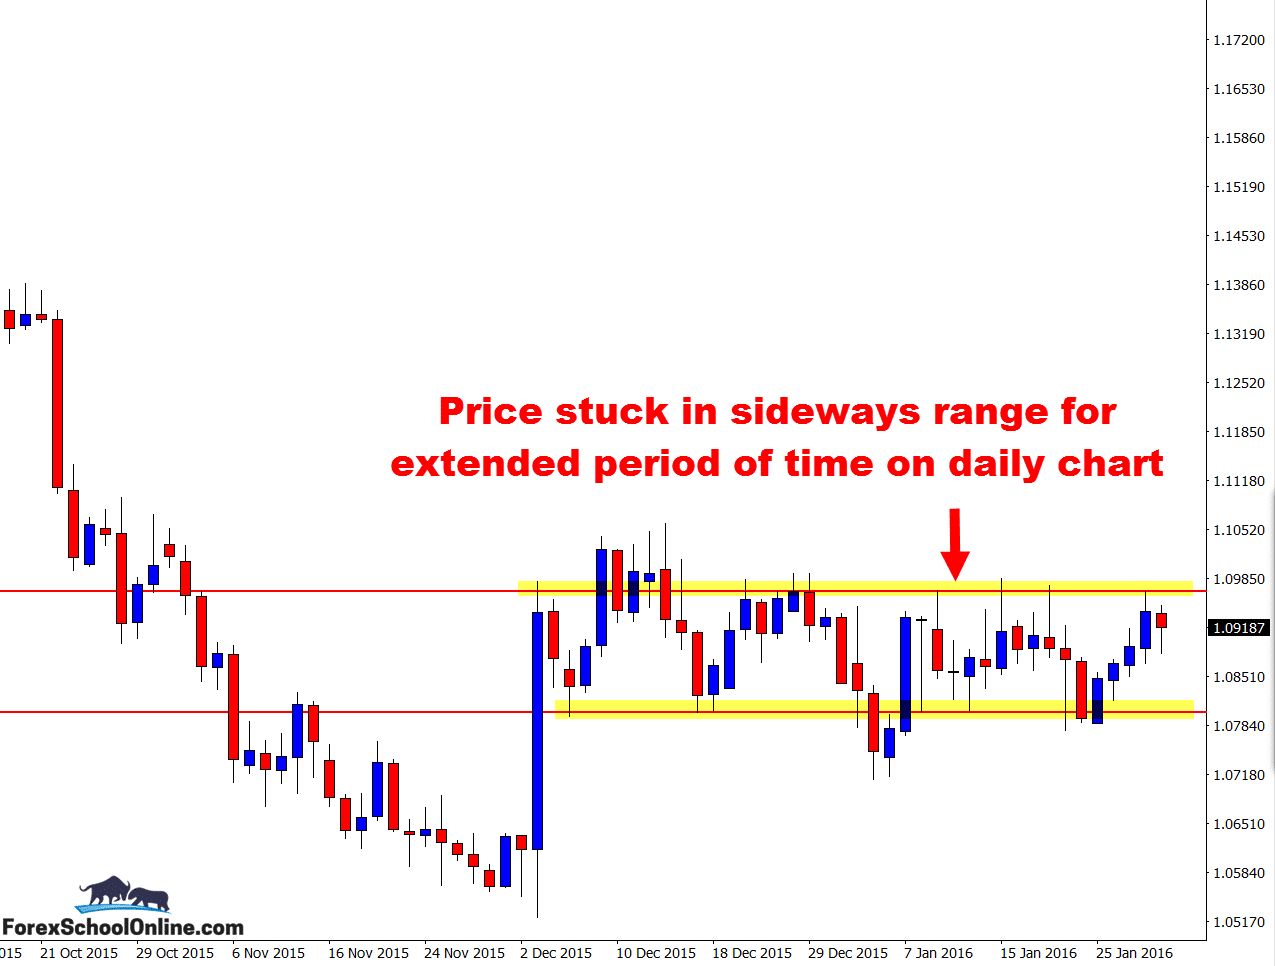
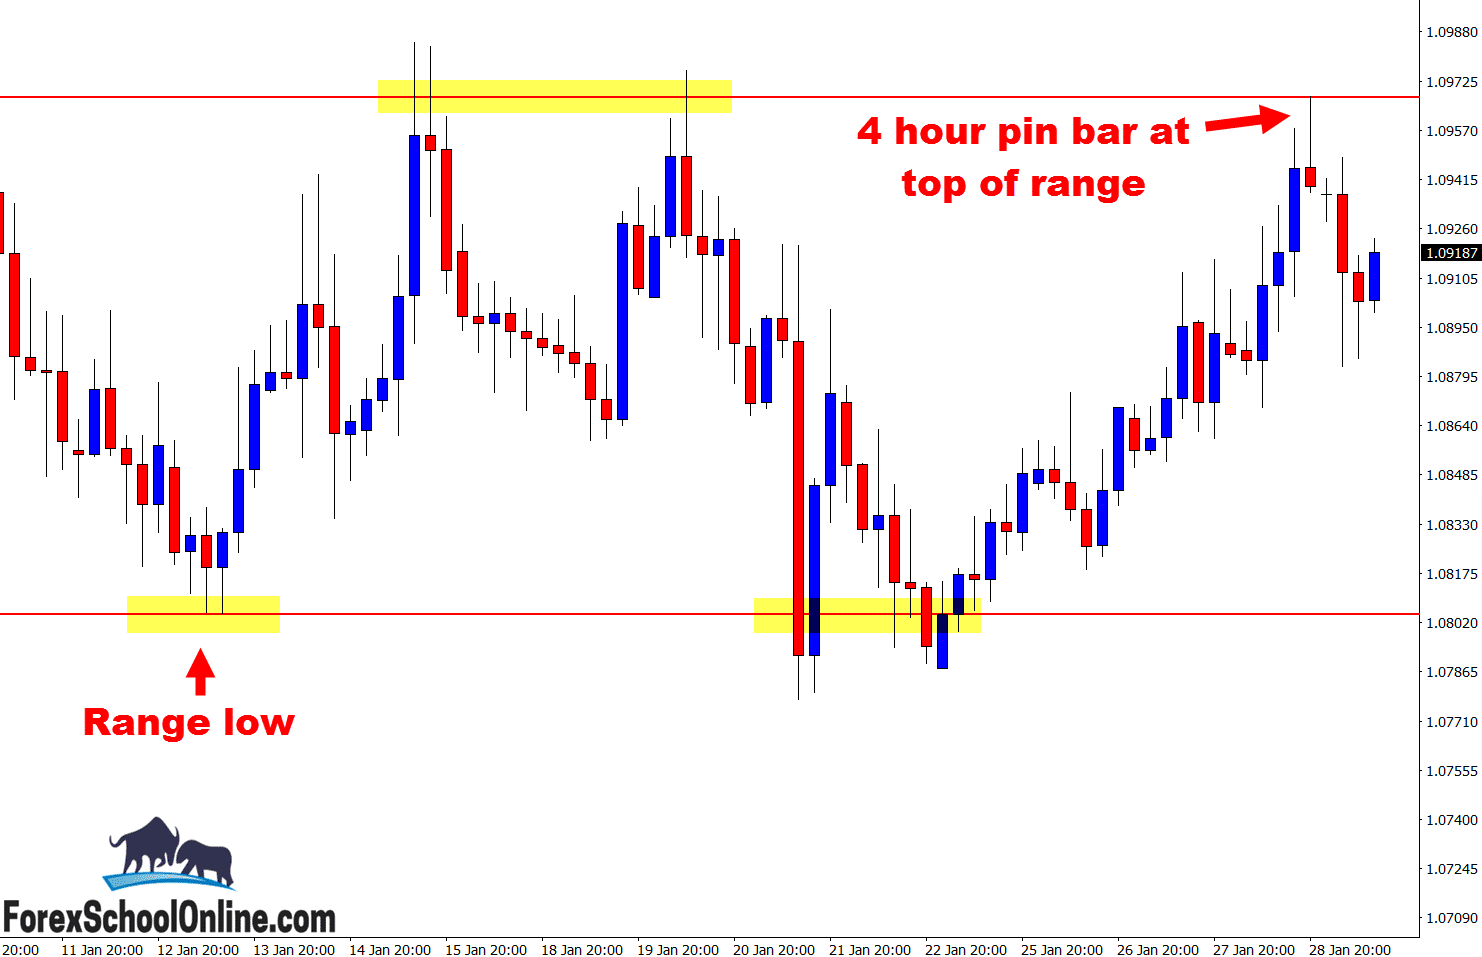
Is the EURUSD building up and getting ready for a MASSIVE breakout? A breakout like we have seen recently on the USDJPY higher time frames?
The most important question is;
If price does breakout > do you know how to take advantage?
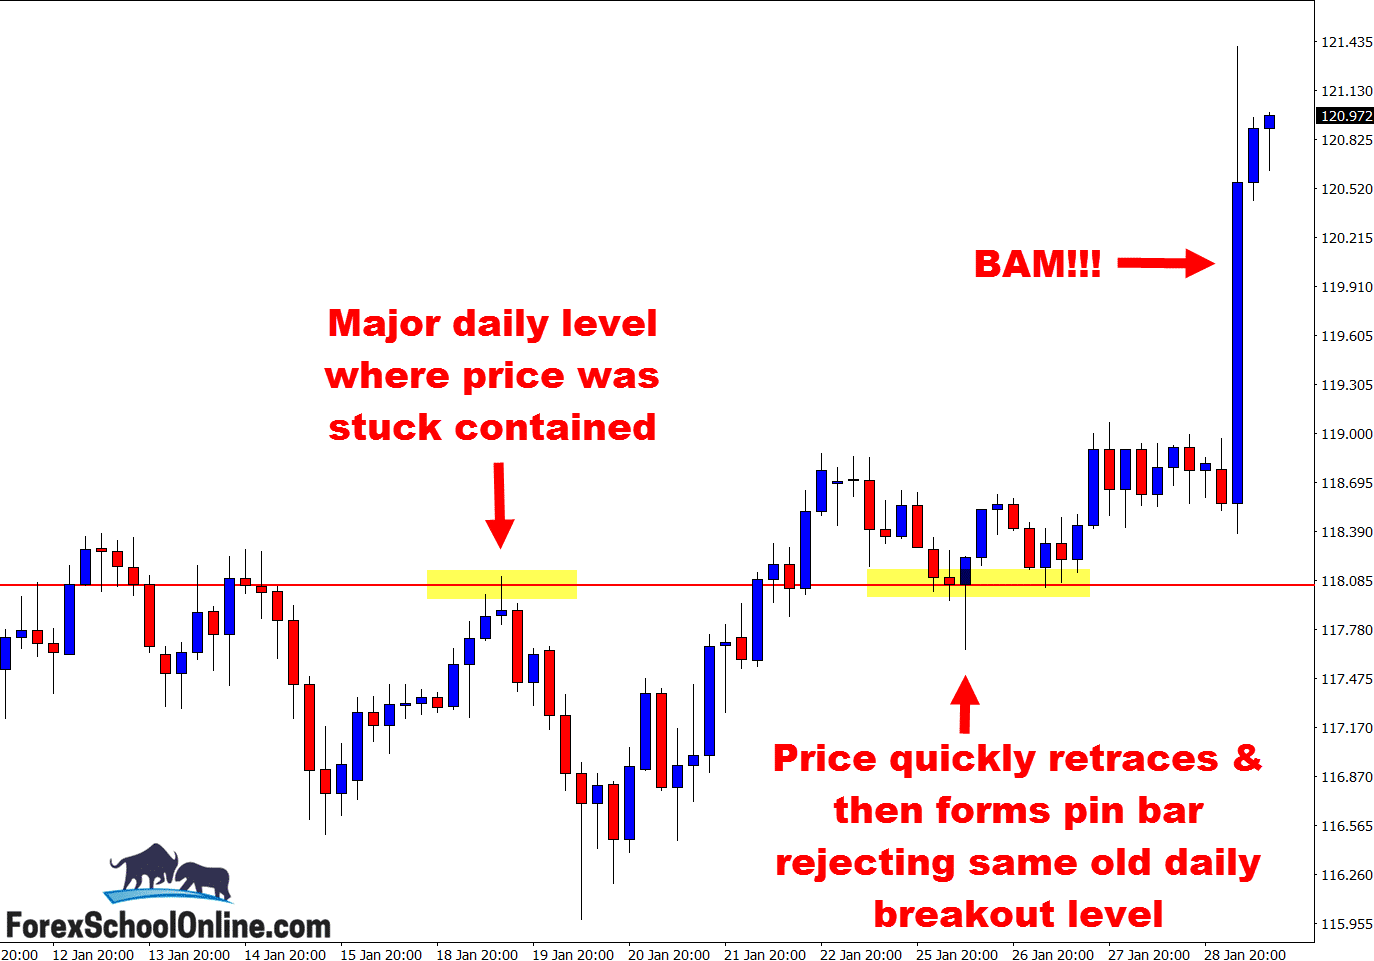
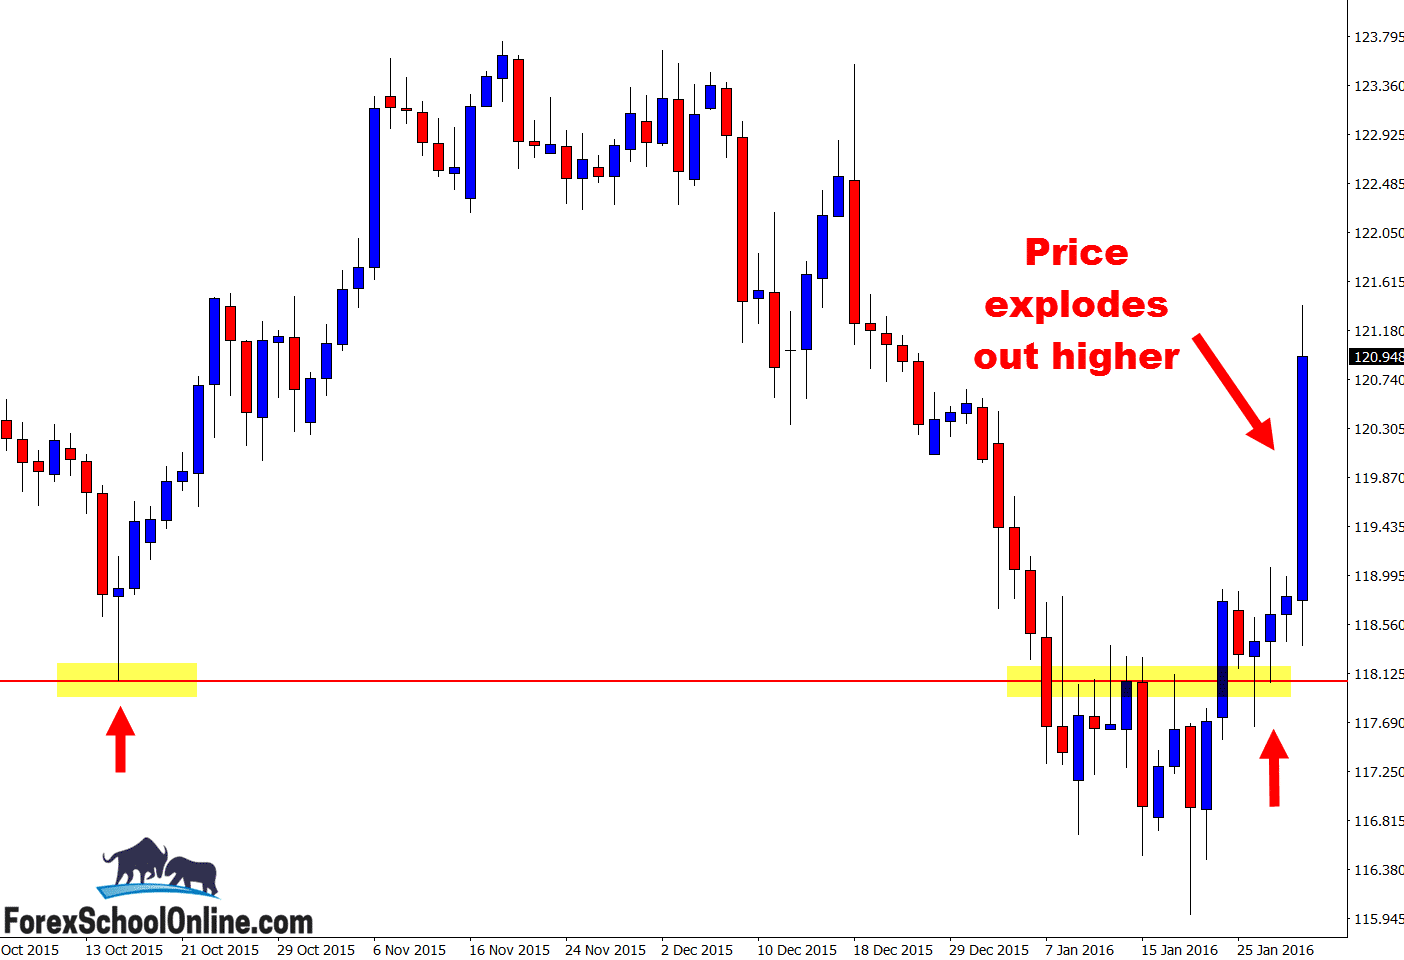
If you look at the charts below you will see the daily and 4 hour charts of the USDJPY. I have attached these charts because they are a really good example of how price could play out over the following sessions on the EURUSD and also for what price action traders need to be on the lookout for.
Of course it goes without saying in scenarios like this when price has been in a tightly contained sideways range that price action traders need to be looking for high probability breakout trade setups, but you also need to be on the lookout for the trade setup titled “Breakout & Re-test”.
Basically the way this trade setup works is that you are waiting for any clues or early signals that price is making a breakout. As soon as you start to see price make a break either higher or lower, you then flip to the smaller time frames and begin to look for price to make a quick retrace back into the old breakout area.
For example; if price breaks out higher, then you would be looking for price to make a quick rotation back lower and into the old resistance and new support level. At this new support level you would look to get long with the new strong breakout momentum.
I have explained it best in the trading lesson that shows you how to hunt these entries at;
First Test Support or Resistance Price Action Strategy
EURUSD Daily Chart – Sideways Range

EURUSD 4 Hour Chart – Pin Bar Reversal

USDJPY Daily Chart – Exploding Daily Chart
USDJPY 4 Hour Chart – BAM!!!

Related Forex Trading Education


Leave a Reply