EURUSD Analysis – Price Maintains Sideways Movement Between Key Levels
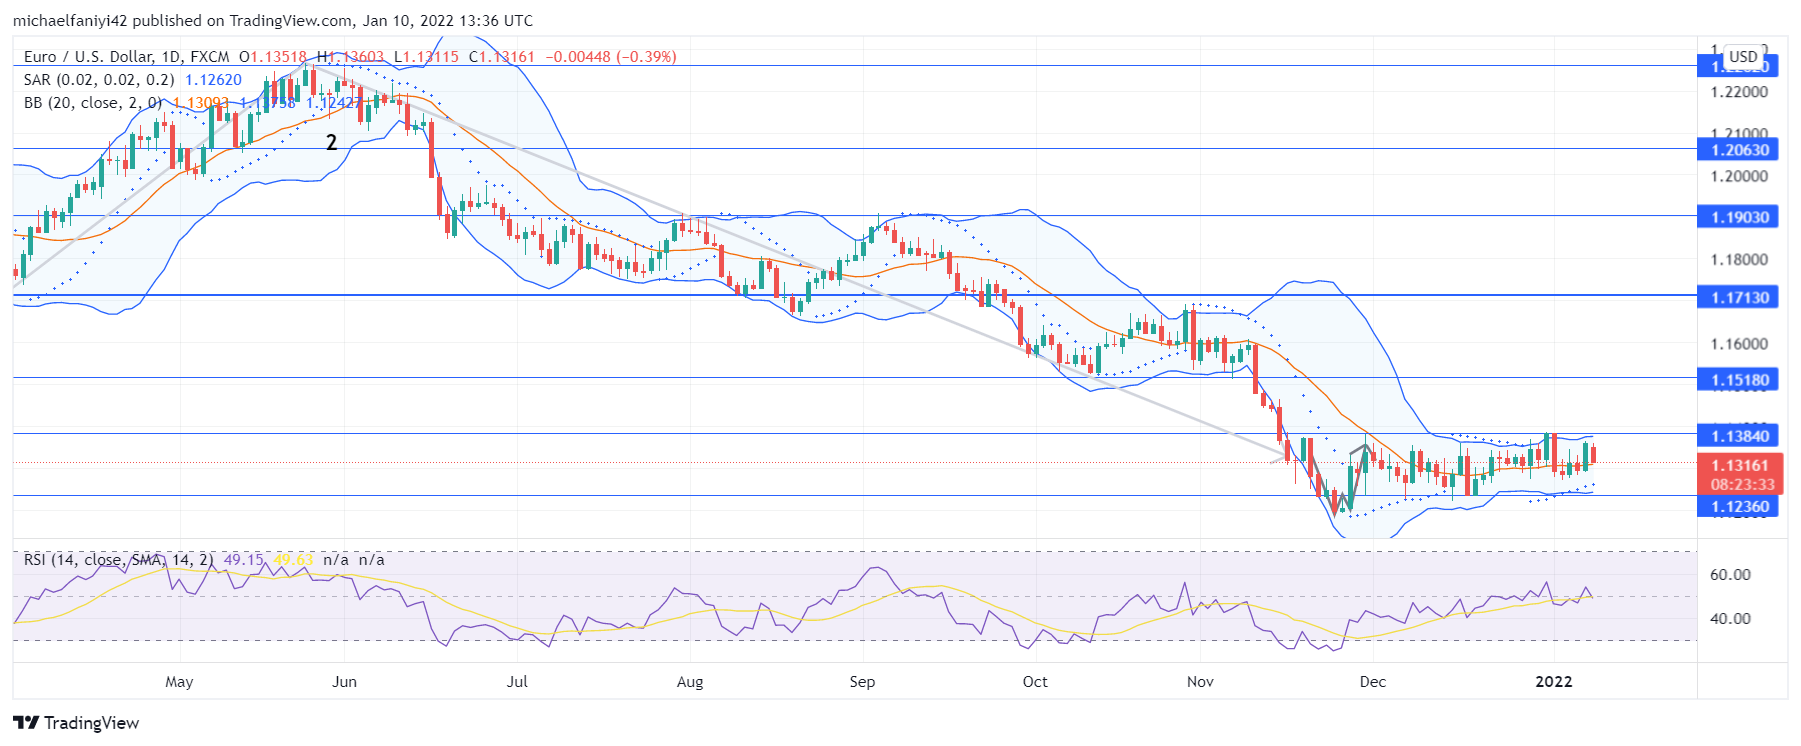
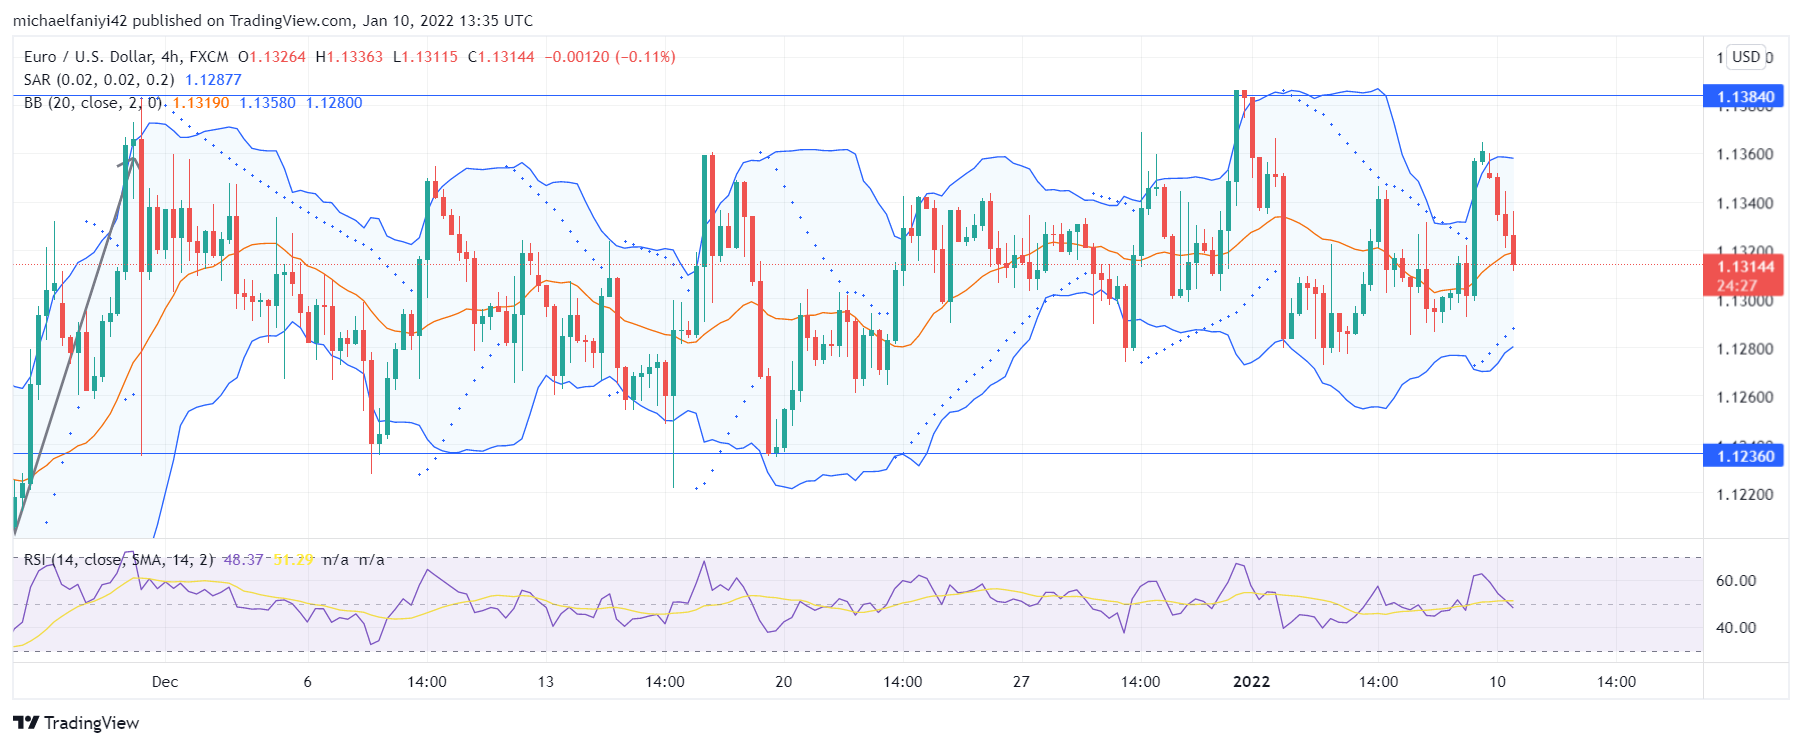
EURUSD maintains a back and forth movement between the key levels of 1.13840 and 1.12360. The undulating pattern of movement ensures that the market doesn’t make significant movement upwards or downwards. Price, therefore, maintains a sideways movement. Despite the seemingly back and forth movement, the market can be seen to be agitated as it crashes against the borders of the ranging channel.
EURUSD Key Levels
Supply Levels: 1.13840, 1.15180
Demand Levels: 1.12360, 1.09900 The continuous sideways movement is a result of an attempt by the market purchasers to put an end to the fall in the market price. But also, the ongoing back and forth movement means that the pressure on the market to keep dropping is still consistent. Therefore, at present, the falling pressure of the market equates to the upward thrust against the price. As a result, EURUSD maintains a sideways movement.
The latest move in the market sees it crash against the upper significant level at 1.13840, then retrace to the mid-level of the Bollinger Band, which rebounds the market upwards. Meanwhile, the upper and lower Bollinger Bands are squeezing into the daily candles more and more. This means a break out to the upside or the downside of the consolidation zone is imminent. The middle line is, however, supporting the market and pushing for a breakout upwards.
 Market Anticipation
On the 4-hour chart, the price undulates around the middle level of the RSI (Relative Strength Index) indicator. In the most recent market moves, the price can be seen to make a significant move upward to the bullish half of the chart. This means that the EURUSD will likely dash itself again against the 1.13840 price level, and it might make it beyond the level this time to 1.15180.
Note: Forexschoolonline.com is not a financial advisor. Do your research before investing your funds in any financial asset or presented product or event. We are not responsible for your investing results.


Leave a Reply