Market Analysis – EURUSD Has Been Moving Sideways and Continues So in a Channel
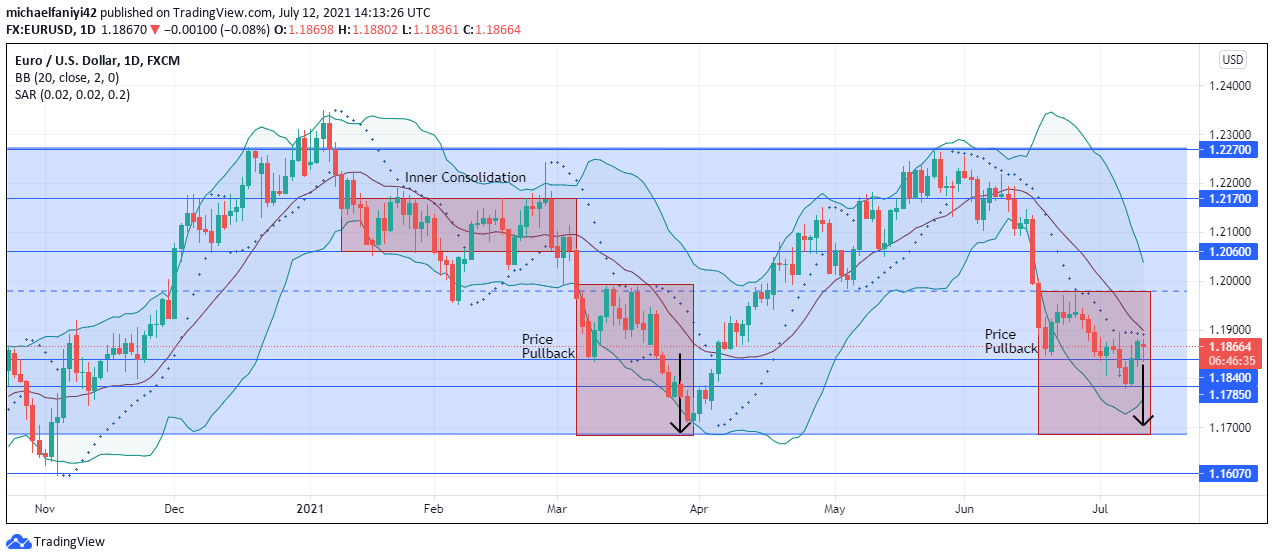
EURUSD continues sideways after being confined to a channel. The movement of the Euro-Dollar pair from last year into this year has been nothing short of sideways. This is seen in the zigzagging movement of the Bollinger Bands. The market was repelled by a strong demand level at 1.6070 on the 4th of November 2020, which let the market climb up entering into the New Year. The bullish movement was stopped just a little beyond the 1.22700 supply level. This also plunged the market. However, the downward movement of the market was not as smooth sailing as the upward movement. Price first met an inner consolidation where there was sideways movement. Then moving further down, there was a pullback before the final plunge to the lower border of the channel. This plunge period is from the 7th of January to the 31st of March 2021.
Thereafter, the market bounced off the lower border and reached for the 1.22700 supply level where it was rejected for a fall again. Coming down, EURUSD is in a similar situation to the initial plunge. The market experienced a pullback to the middle of the channel where it was rejected. But unlike the initial plug, there is a second retracement happening. The Parabolic Stop and Reverse on the daily chart confirms that the pull-back hasn’t affected the general bearish plunge.
EURUSD Key Levels
Supply Levels: 1.22700, 1.21700, 1.20600
Demand Levels: 1.18400, 1.17850, 1.16070
 Market Prospects
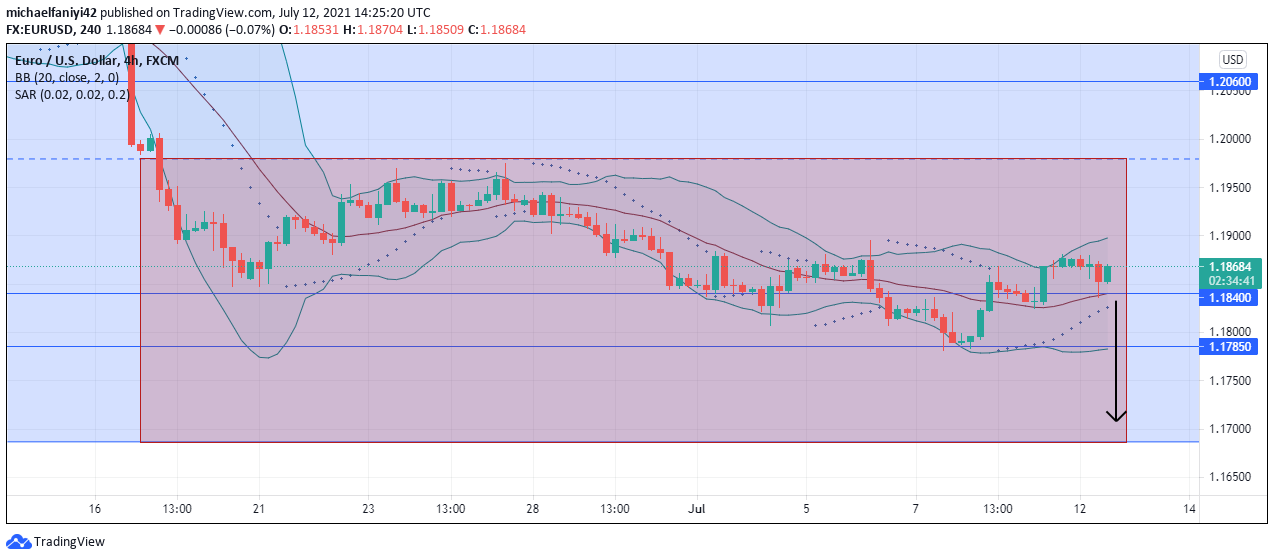
The Parabolic SAR reflects price pullback on the 4-hour chart, even as the middle line of the Bollinger Band is bouncing the market up in conjunction with the 1.18400 demand level. But having reached the upper band, the market will fall and continue in its movement downward.
Note: Forexschoolonline.com is not a financial advisor. Do your research before investing your funds in any financial asset or presented product or event. We are not responsible for your investing results.


Leave a Reply