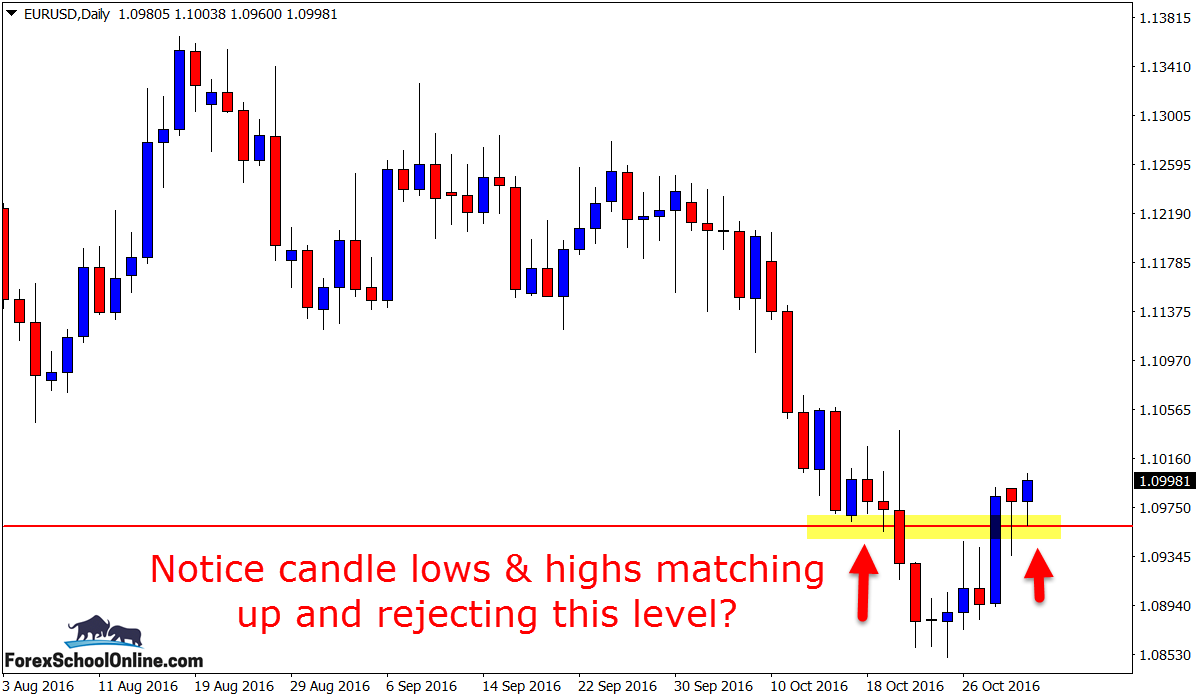
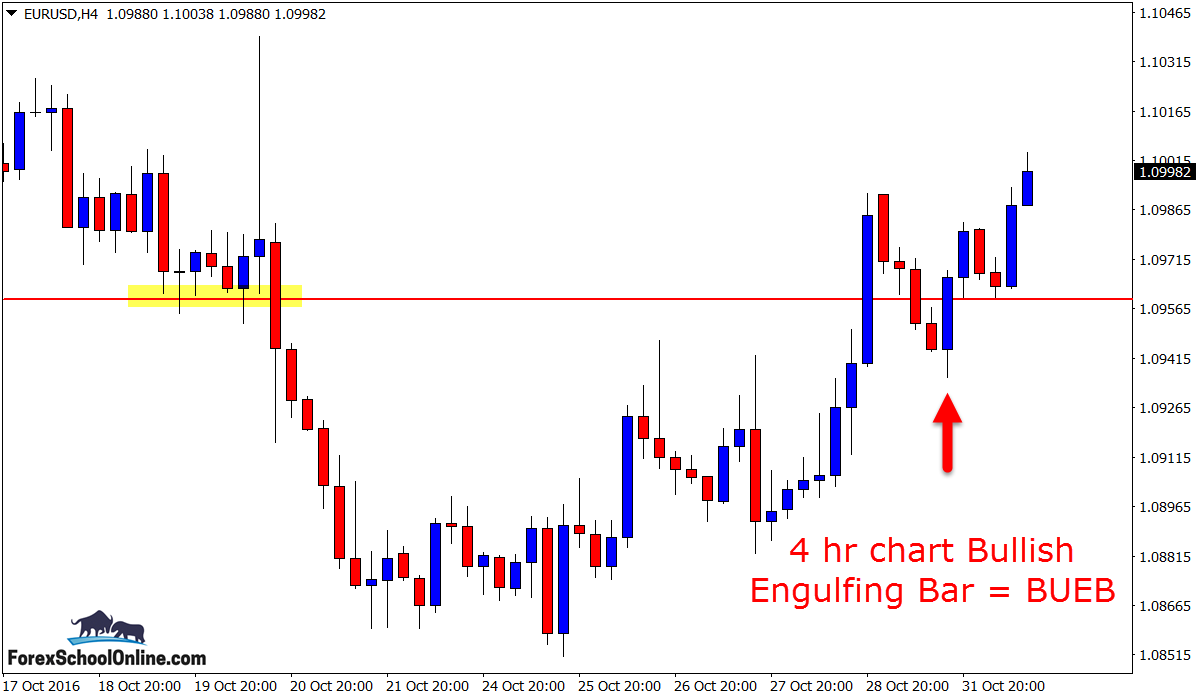
Price on the 4 Hour chart of the EURUSD is bursting higher and breaking away from the major daily level after firing off a solid Bullish Engulfing Bar ‘BUEB’.
This Bullish Engulfing Bar was rejecting the support level that price has just recently broken lower and below on the daily chart. I have attached just below the daily chart so you can see how price broke lower and if you move to the EURUSD daily chart on your own charts and mark this level; you will see how far back this level goes and how it is a major and proven price flip.
When price started to make the move back higher and back through the major resistance level again, it looked as if it was going to break straight through, but as is so often the case – price made a quick retrace and quick pull-back into the old resistance and new support before continuing.
This order flow pattern repeats literally every single day and traders that understand it and more importantly understand where to look for it and are waiting for it can take advantage of it in their trading.
So often, price just like in this setup here will make the first move and first breakout and then pause or rotate back into the old support or resistance, give us a small / quick chance to make a trade, and then continue.
If you look at the 4 hour chart here, we have the old resistance where price has retraced back into, that is where we are going to hunt for long trade setups because it is where we are going to be looking for price to hold as a new support.
A really high probability strategy you can use in these scenarios so you can get in at the strongest areas is;
Finding High Probability Trades at The First Test of Support or Resistance
It then becomes about finding really quality trigger signals to get into the trades no matter what time frame you are trading and learning how to manage your trades with great decisions time after time.
Daily EURUSD Chart

4 Hour EURUSD Chart

Related Forex Trading Education


Leave a Reply