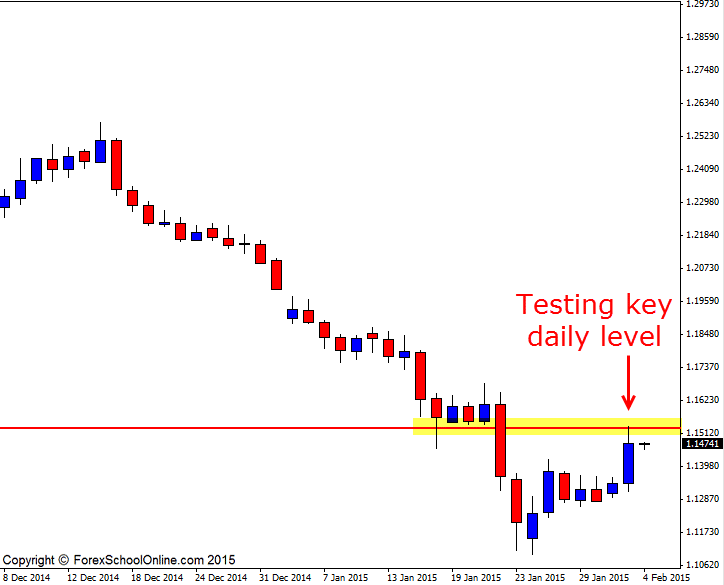
The EURUSD has fired off a pin bar reversal at a key daily resistance level where price had previously stalled and found support in the strong trend lower. As the first daily chart shows below; the trend lower has been both aggressive and extended with price making a series of lower lows.
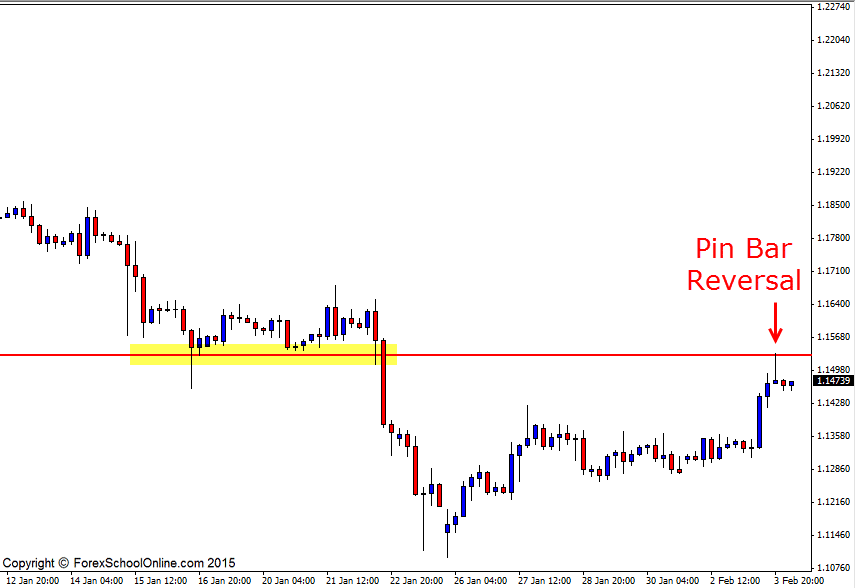
This pin bar on the 4 hour chart comes up at the swing high rejecting the daily resistance level. Whilst this pin bar is not the biggest pin bar, it is sticking up and away from all other price with the nose protruding out from the rest of the price.
For this pin bar to have any chance of sending price back lower, price would have to confirm the setup and break the pin bar low as I discuss in the price action trade entry tutorial; Increase Your Win Rate by Taking The Break
The downside to this setup is that it has formed during the Asian session. We normally want to see intraday setups forming during either the UK or US sessions unless the pair is directly correlated to the Asian market for example; the AUDJPY or NZDJPY etc.
Other markets that tend to be traded all day around are markets such as the commodity markets because these markets do not have one central market and unlike a Forex pair like the EURUSD where a heavy portion of the trading is going to be done in both Europe and the US, not Asia, markets such as Oil will be traded all day around.
With this in mind, the Oil market has also formed a very similar pin bar to the EURUSD market on it’s 4 hour chart. The difference with the Oil setup is that on the 4 hour chart there has been a very strong move and momentum back into the resistance level and so just like with the EURUSD, we would need to see a strong break back lower and confirmation for price to make a solid move.
EURUSD Daily Chart

EURUSD 4 Hour Chart

Related Forex Trading Education
– The Secrets Traders Can Learn From Reading The Candlesticks & Price Action


Leave a Reply