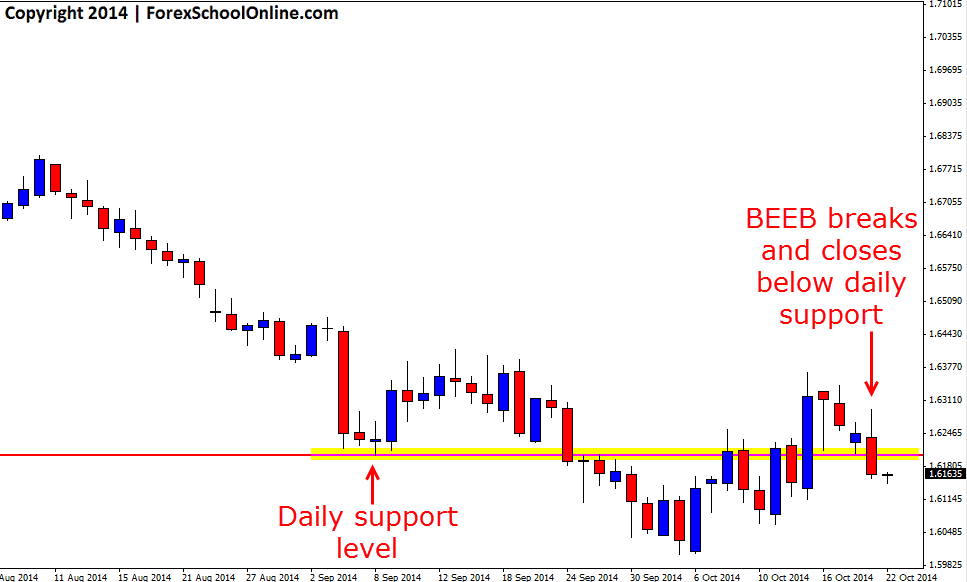
The EURSGD has fired off a Bearish Engulfing Bar (BEEB) that has now broken and closed below a key daily support level on the daily price action chart. This bearish engulfing bar finished close to the session lows with the selling continuing right through to the end of the session. As the daily chart shows below; this level has been a very important level in recent times with the level acting as both support and resistance.
If this bearish engulfing bar can break and gain momentum, there is a near term support level around the 1.61110 area that could come in as the first support trouble area. After that if price can continue on with the strong selling, then the next support could be around the recent swing lows.
If price retraces back higher it could give those intraday traders looking to get short from any retracements higher a chance to look for short trades. The key daily level overhead that was acting as a major support level could become a price flip level and look to act as a new resistance area. Should price rotate back higher and into this potential new resistance area it could give traders a chance to look for short trades on their smaller intraday time frame charts such as the 4 hour, 1 hour or even smaller time frame charts.
EURSGD Daily Price Acton Chart

Related Forex Trading Education
– What are Price Flip Areas and How to Hunt High Probability Trades From Them


Leave a Reply