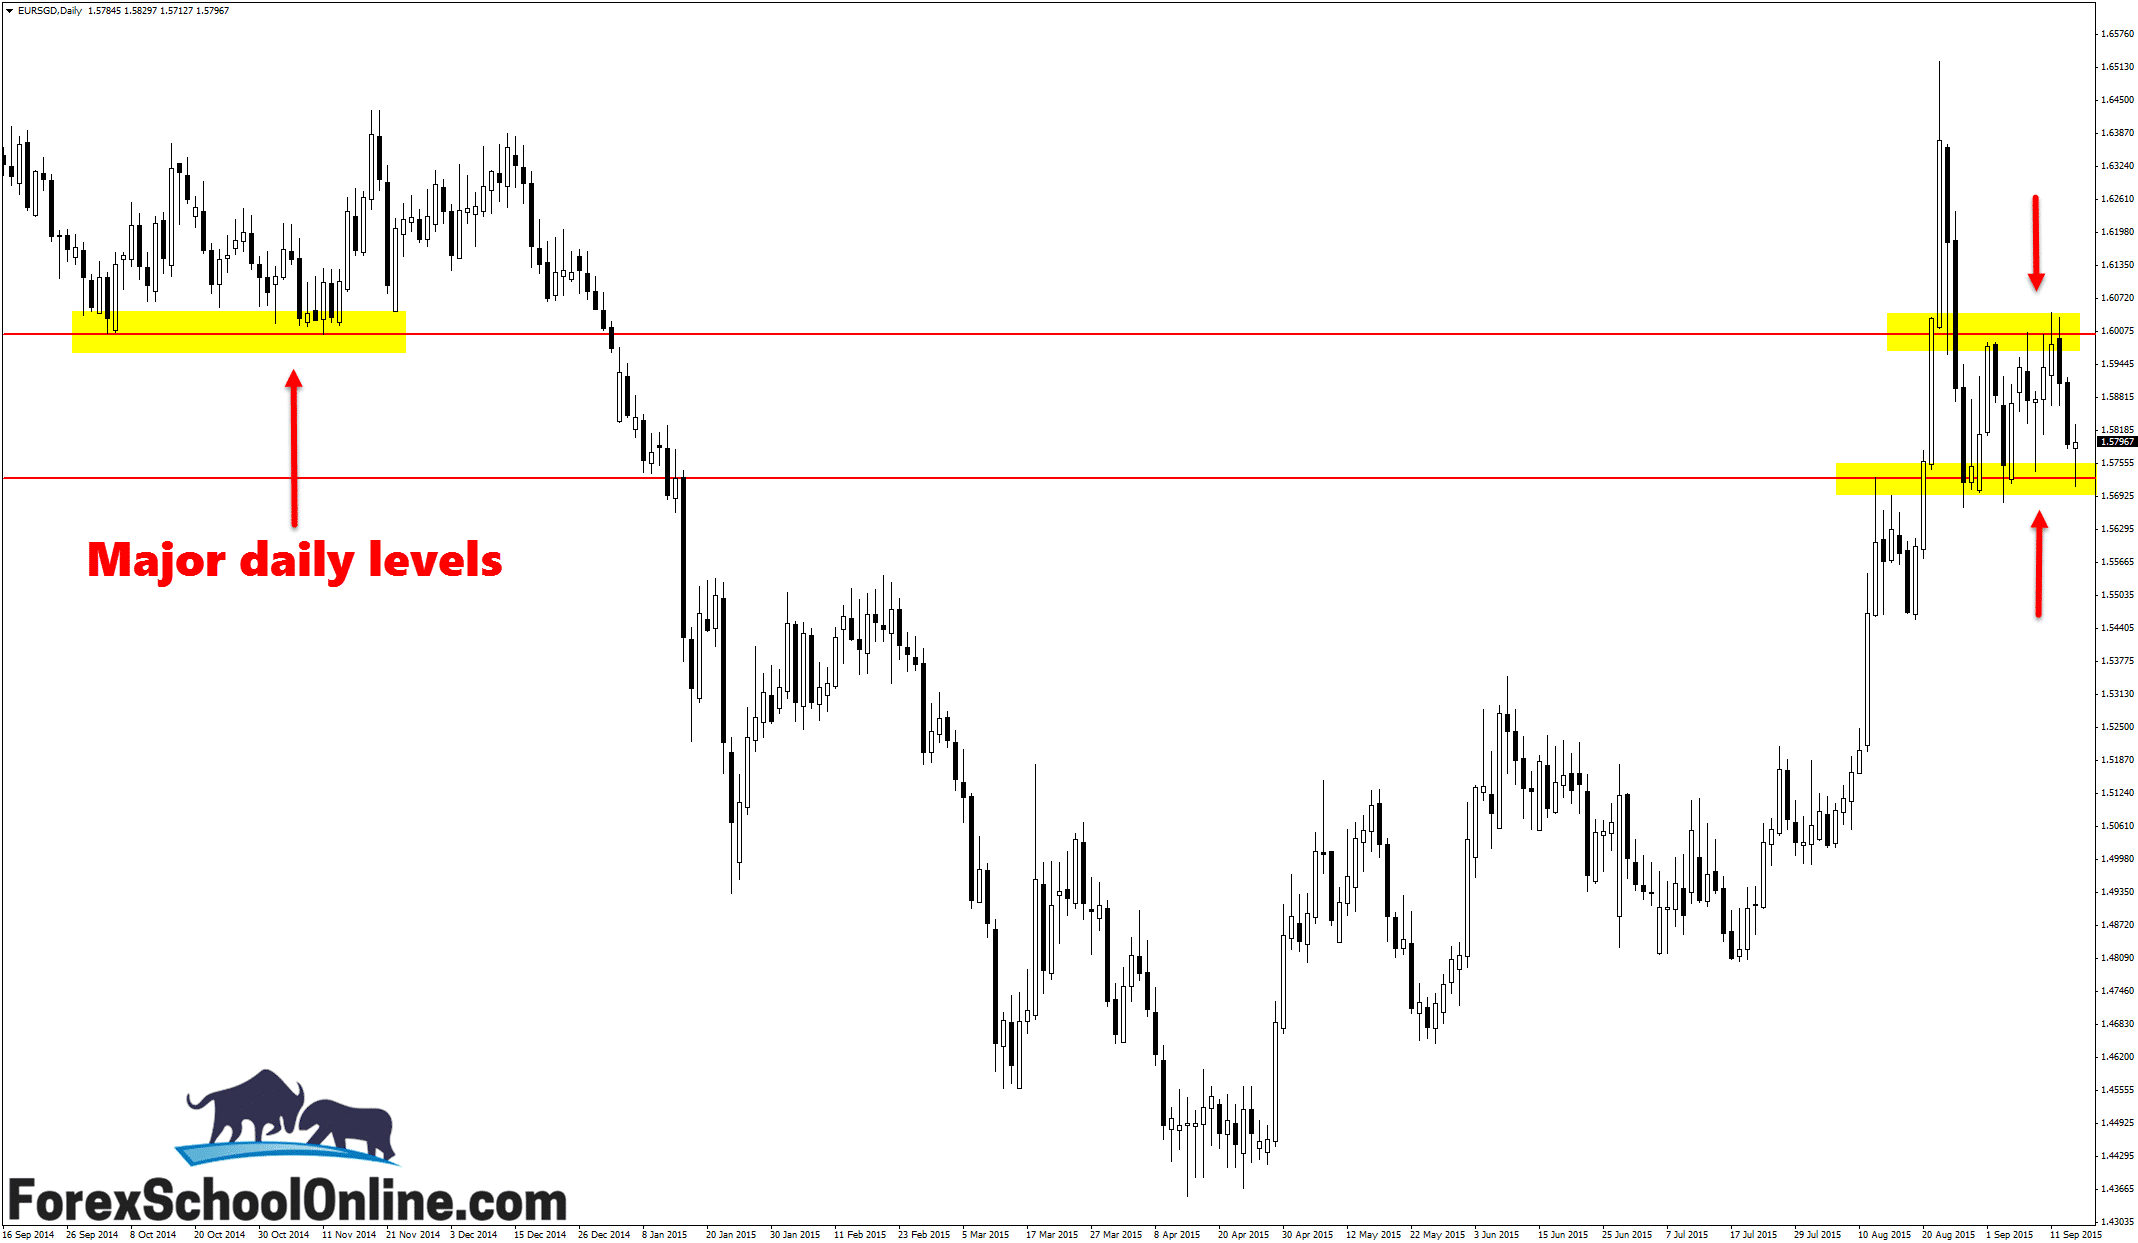
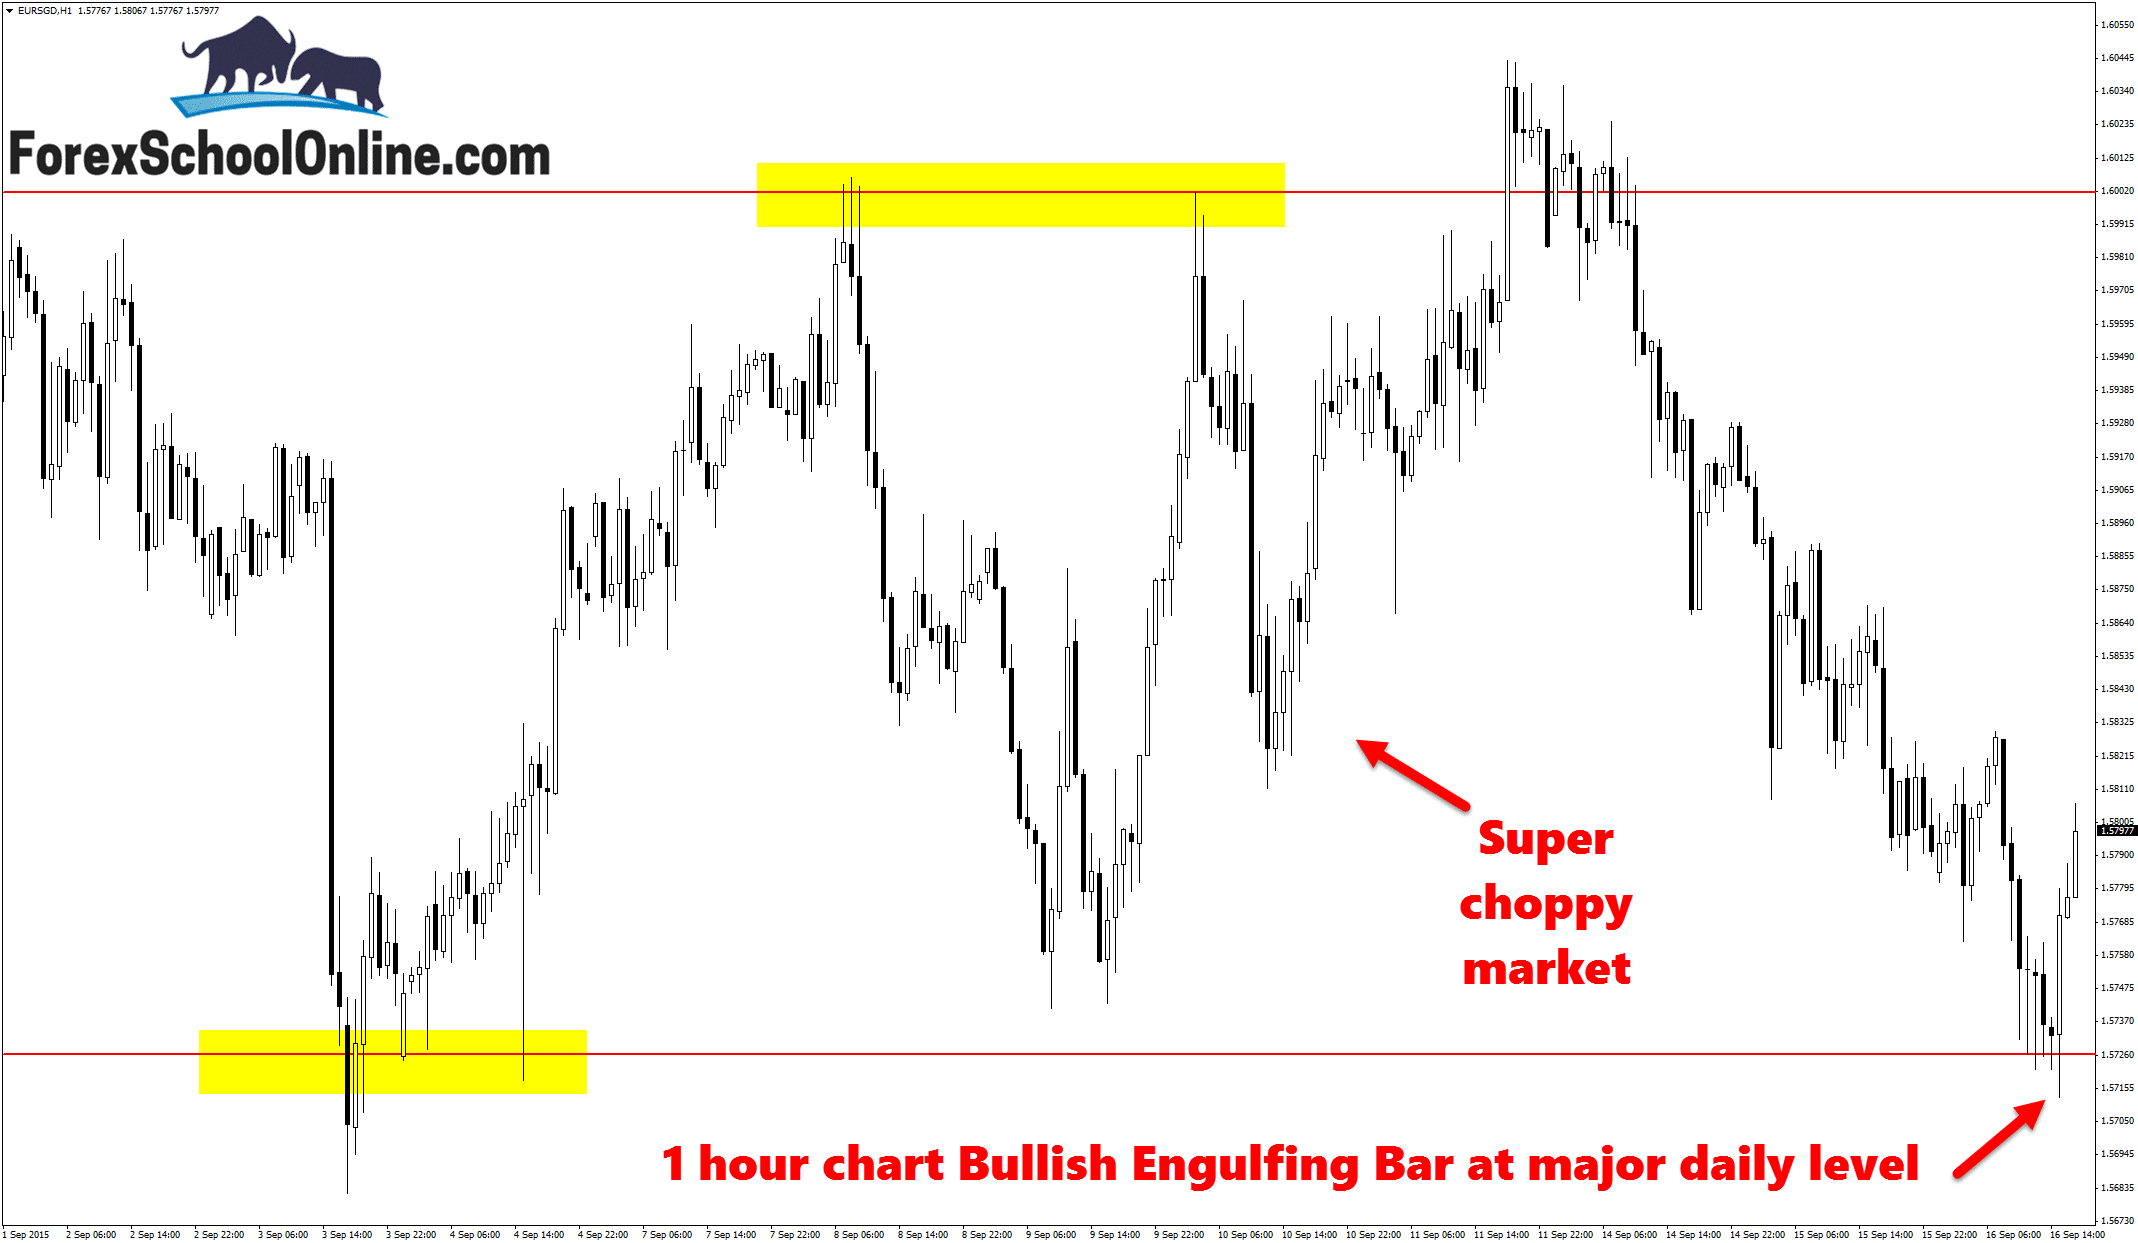
Price has fired off a large Bullish Engulfing Bar = BUEB at a major daily support level on the 1 hour price action chart. This bullish engulfing bar is a commanding engulfing bar and is engulfing the previous four candles which is a good sign that price has taken control and swung back around to the bulls.
Another tell tale sign and something I often discuss with members in the members only forum is where price closes. If you look at the bullish engulfing bar like I have it pointed out below on the 1 hour chart; price has closed really strongly and up within the last 1/3 of the top of the candle. This is a clear indication that when the bullish engulfing bar closed, the bulls were still in control and there were still plenty of buyers left in this market.
If this was not the case and for example price closed back much lower at around the half way mark, this would be a major concern. The candle would still be a valid bullish engulfing bar because price is still engulfing the previous candle, however price would not be telling us the same story.
Price would now be showing that instead of closing right near the high and closing with a lot of buyers still in the market, price had found a resistance area and been rejected. The bullish engulfing bar would be a far weaker prospect because now we would need to enter a potential setup where instead of taking a setup full of buyers, we would be entering a setup where price is a lot more uncertain.
As price action traders (and not pattern traders) it is our jobs to read the whole price action story and to make really high probability trades time and time again. We are going to have losses and losing streaks, but if we create an edge over the market, then we will be able to make money by our edge coming out on top overall.
As the chart shows below; the 1 hour chart is a super choppy market with a heck of a lot of traffic and sideways action to trade back into overhead. If price can break and make a sustained move higher, the first resistance comes in around the 1.5812 area with the next level around the 1.5865 level.
A question I get asked regularly is around time frames and what time frames can you trade. I discuss this question in the trading lesson Trading Daily Chart Price Action Strategies Down to the Intraday Charts to answer this question for you, but if you have any other questions on this or anything else please just post them in the comments below.
Daily Chart

4 Hour Chart

Related Forex Trading Education
– Trading Daily Chart Price Action Strategies Down to the Intraday Charts


Leave a Reply