Euro Price Prediction – April 22
The market worth of EUR/CHF has over a few weeks of trading been witnessing variant degrees of rises and falls in a correctional moving outlook.
EUR/CHF Market
Key Levels:
Resistance levels: 1.1100, 1.1200, 1.1300
Support levels: 1.0900, 1.0800, 1.0700
EUR/CHF – Daily Chart
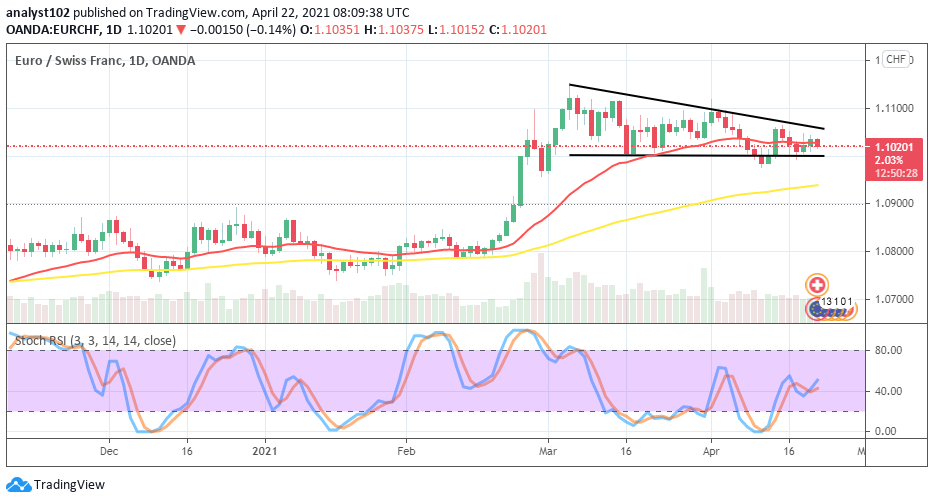
The EUR/CHF daily chart has shown that the currency pair’s value has pushed southwardly to letting in the formation of a baseline support level around 1.1000. The correctional bearish trend line is drawn a bit over the smaller SMA trading indicator. The 50-day SMA trend-line is a bit over 1.0900 underneath the 14-day SMA trend-line. And, they all appear to point toward the east to suggest the possibility of getting to see an indecision trading moment in the EUR/CHF pair soon. The Stochastic Oscillators seemingly start a consolidation movement around range 40 to attest to the probable indecision situation of the forex market.
Will EUR/CHF Price propel further from the 1.1000 baseline?
It is much expected of the EUR/CHF bulls to a stance to build up against any further falling pressure that the price may be tending to experience any longer at the 1.1000 level. The emergence of a sudden spike breaking through a mid-point between the baseline and the immediate resistance level of 1.1100 will be necessary to suggest a return of bullish trend continuation out of the present retracement moves.
About the downward price movements of this market, bears have to hold stronger against the price approaching the resistance of 1.1100 for a breakout. Failure to push back at that level will lead the currency pair to achieve other higher values that may easily let Euro’s value surge higher to another peak line. However, a rejection of price may also play along. But, it may not easily happen in the near time to favor the sellers.
Summarily, more buying opportunities will most likely still play out in this market operation, Only traders need to be considerate of their entry points.
EUR/CHF 4-hour Chart
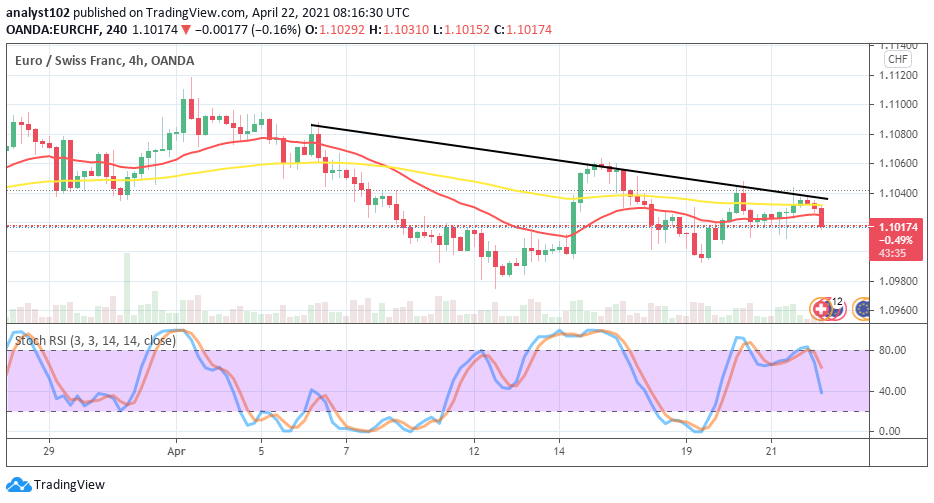
The 4hour medium-term trading chart depicts as at the time of writing that the EUR market price as paired with the CHF is under selling pressure. The level of 1.1040 on the chart appeared to be the key resistance zone against the efforts of the base instrument upsurging from a down point. Both the SMAs are closely located within the 1.1040 and 1.1020 price levels. The 14-day SMA trend line is below the 50-day SMA indicator pointing towards the east direction. The Stochastic Oscillators have crossed towards the south to touch range 40. That suggests that downward pressure is ongoing in the market. In the process of that falling pressure holding strong, the previous low point of 1.0100 will be revisited.
Note: Forexschoolonline.com is not a financial advisor. Do your research before investing your funds in any financial asset or presented product or event. We are not responsible for your investing results.
Learn to Trade Forex Online
EUR/CHF Instrument Currently Experiences a Line of Price Retracements
Footer

ForexSchoolOnline.com helps individual traders learn how to trade the Forex market
WARNING: The content on this site should not be considered investment advice and we are not authorised to provide investment advice. Nothing on this website is an endorsement or recommendation of a particular trading strategy or investment decision. The information on this website is general in nature so you must consider the information in light of your objectives, financial situation and needs.
Investing is speculative. When investing your capital is at risk. This site is not intended for use in jurisdictions in which the trading or investments described are prohibited and should only be used by such persons and in such ways as are legally permitted. Your investment may not qualify for investor protection in your country or state of residence, so please conduct your own due diligence or obtain advice where necessary. This website is free for you to use but we may receive a commission from the companies we feature on this site.
We Introduce people to the world of currency trading. and provide educational content to help them learn how to become profitable traders. we're also a community of traders that support each other on our daily trading journey
Forexschoolonline.com is not a financial advisor. Do your research before investing your funds in any financial asset or presented product or event. We are not responsible for your investing results.

Leave a Reply