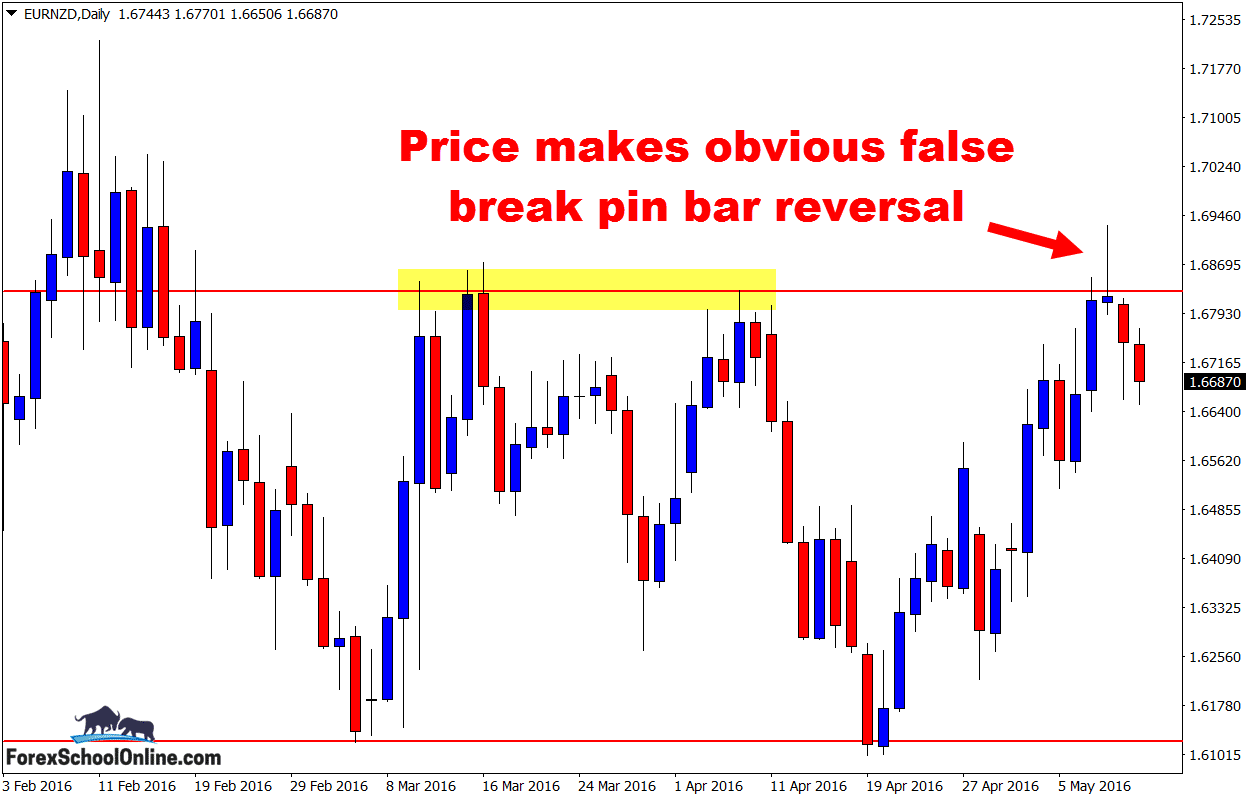
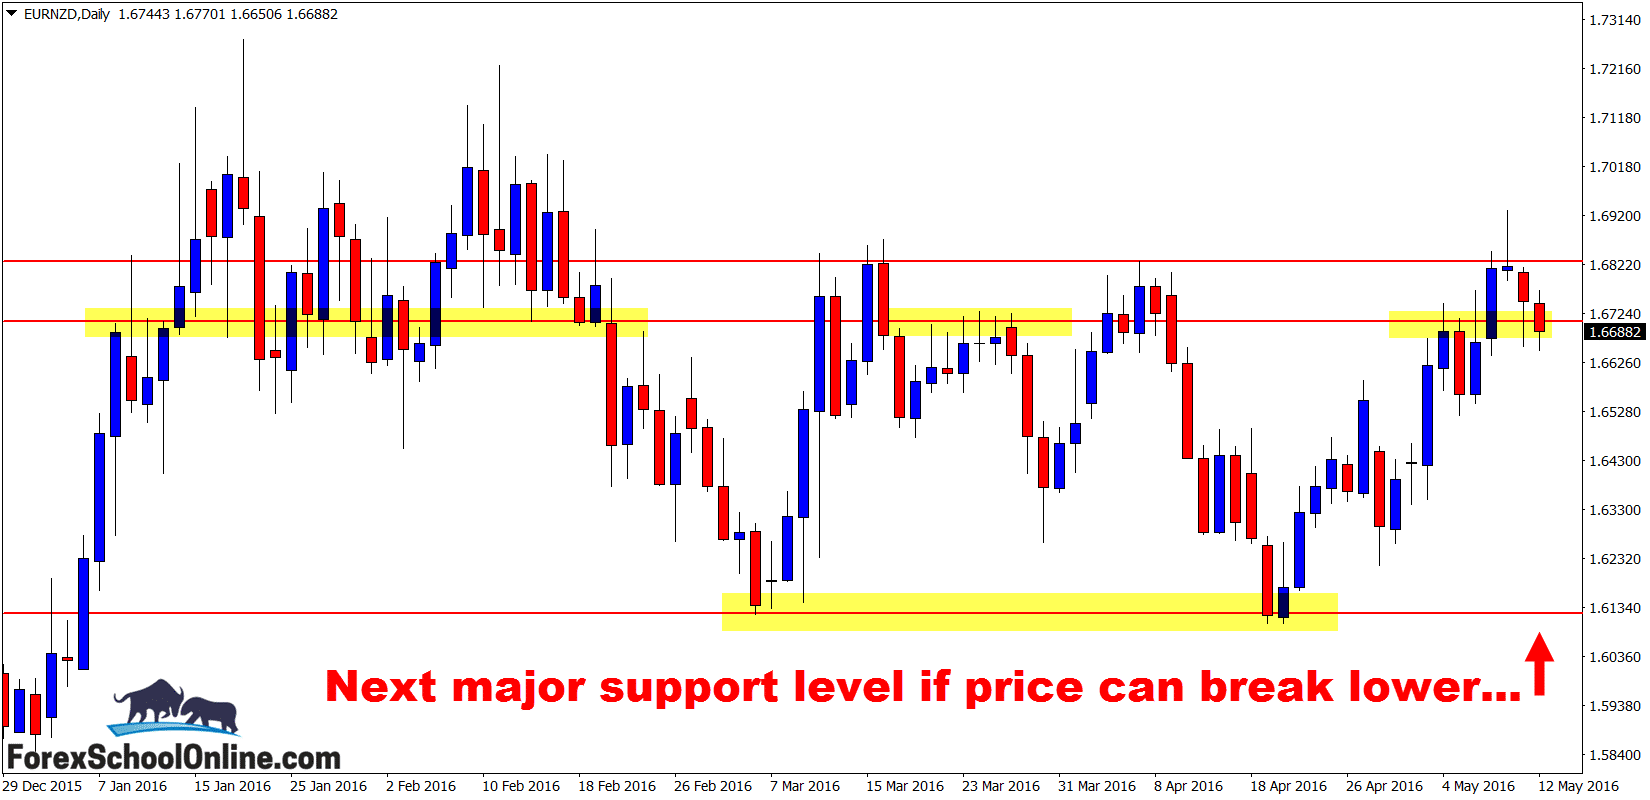
Price on the EURNZD daily chart has now started to move lower after it formed a bearish false break pin bar price action trigger signal.
As I show on the illustration below and I am about to take you through in detail; price on the daily price action chart attempted to breakout of the major resistance level. Price on the daily chart of this pair has been trading sideways and without a clear trend or direction for literally months now, which makes these major levels like the resistance that price was attempting to breakout of even more important.
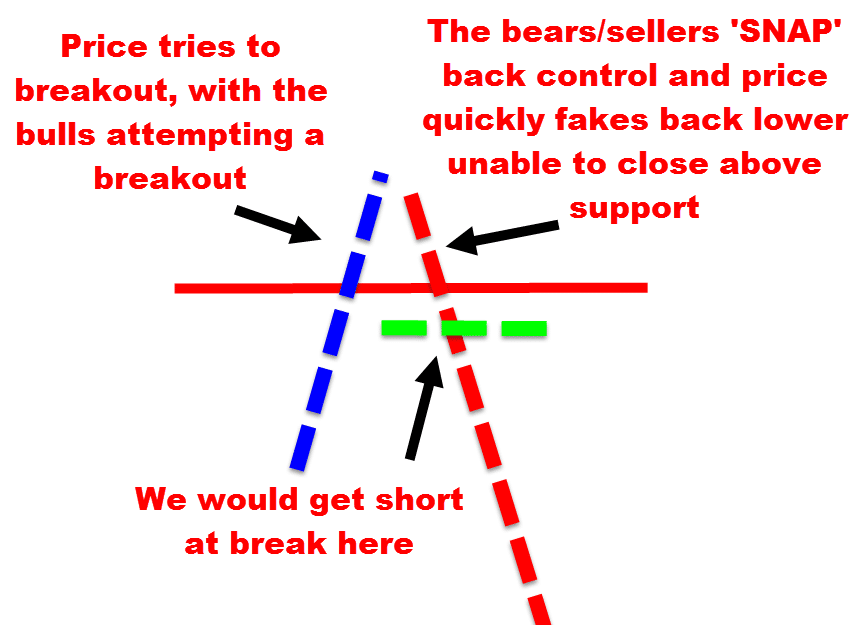
On this first chart you will see I have an illustration showing how a false break works. I also highly recommend you watch the video;
Trading the Live False Break Price Action Trigger Setup
As the illustration shows; the false break works by price first breaking out of a major level. When this first happens it gets a large portion of the market going in the wrong direction. The false break is at it’s most powerful the more people that it can ‘trick’ into trying to take breakout trades in the wrong direction. The reason for this is because when price does make the move or snap back the other way it is these traders stops who will be getting eaten up and getting taken out.
That is why you will see really often price will be very stagnate and not doing anything for a long time in a sideways market with price stuck trying to breakout. Price will be stuck either under or above a key level trying over and over to break through. Price will then eventually make a pop through.
This will be short lived quite often because as quick as price makes the pop through, you will see the snap back and false break with price shooting back the other way in the opposite direction.
We can take advantage of these false breaks by reading the price action clues and being part of a market that is not being faked out.
As price is snapping back lower in this scenario, those traders who were looking to go long and who were looking for the breakout trades will now start to get stopped out. They will start to have their stops enforced and this will only add fuel to the fire and this is why I said above; the more people or the more of the market that get going the wrong way or looking for breakouts in the wrong direction, the bigger and stronger the false breakout will be as it will have more stops as fuel to feed on back the other way.
SUPER COOL Q&A FOR YOU!
I have just launched a new public Q&A where you can ask questions, give answers and also vote on your favorites!
Have a look how it works;
➜ Submit Your Own New Question – Look For Answer!
➜ List of Questions You Can Search & Also Vote On!
How a False Break Forms
Daily EURNZD Chart

Daily EURNZD Chart

Related Forex Trading Education


Leave a Reply