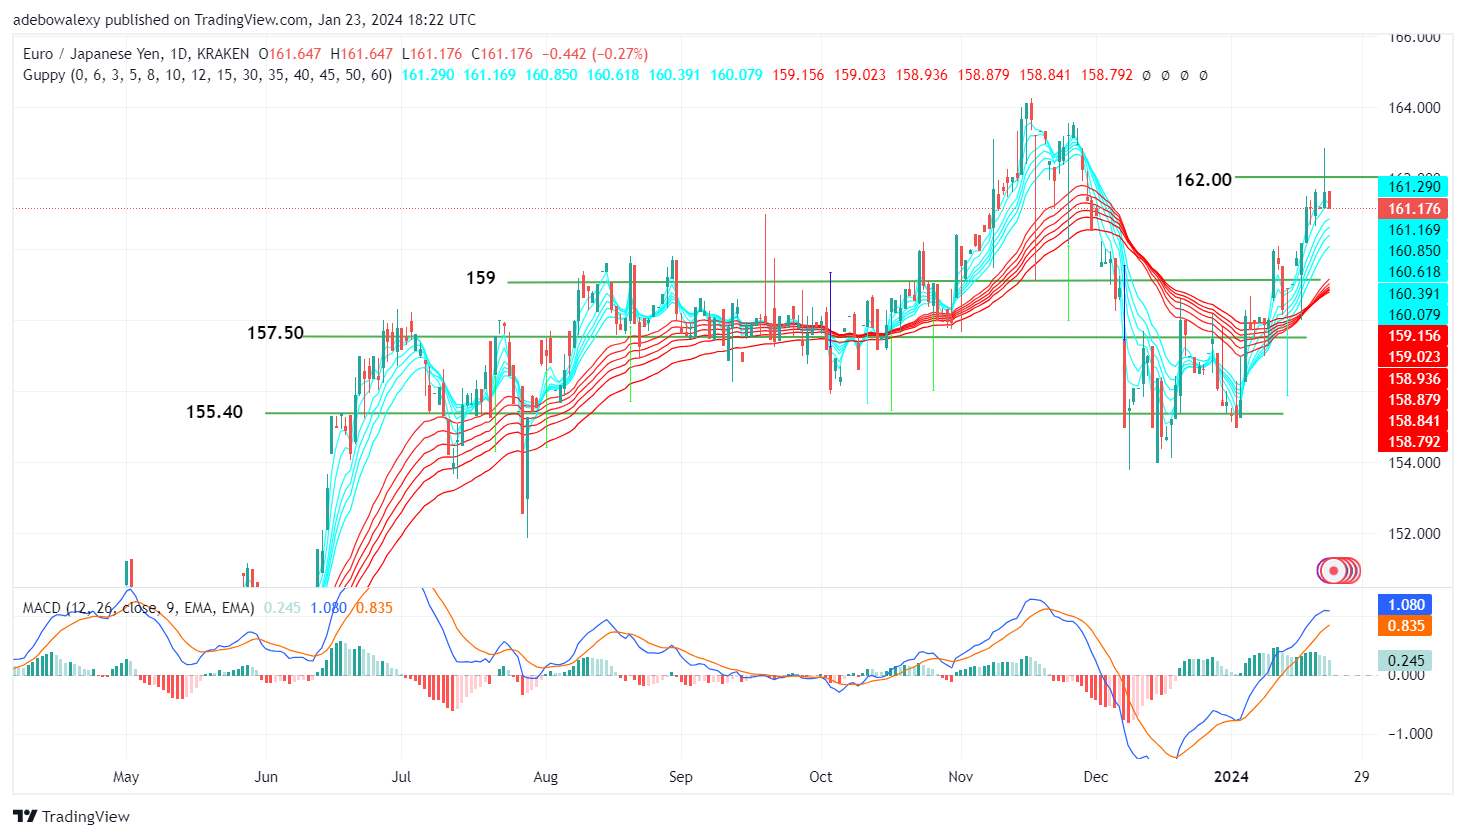
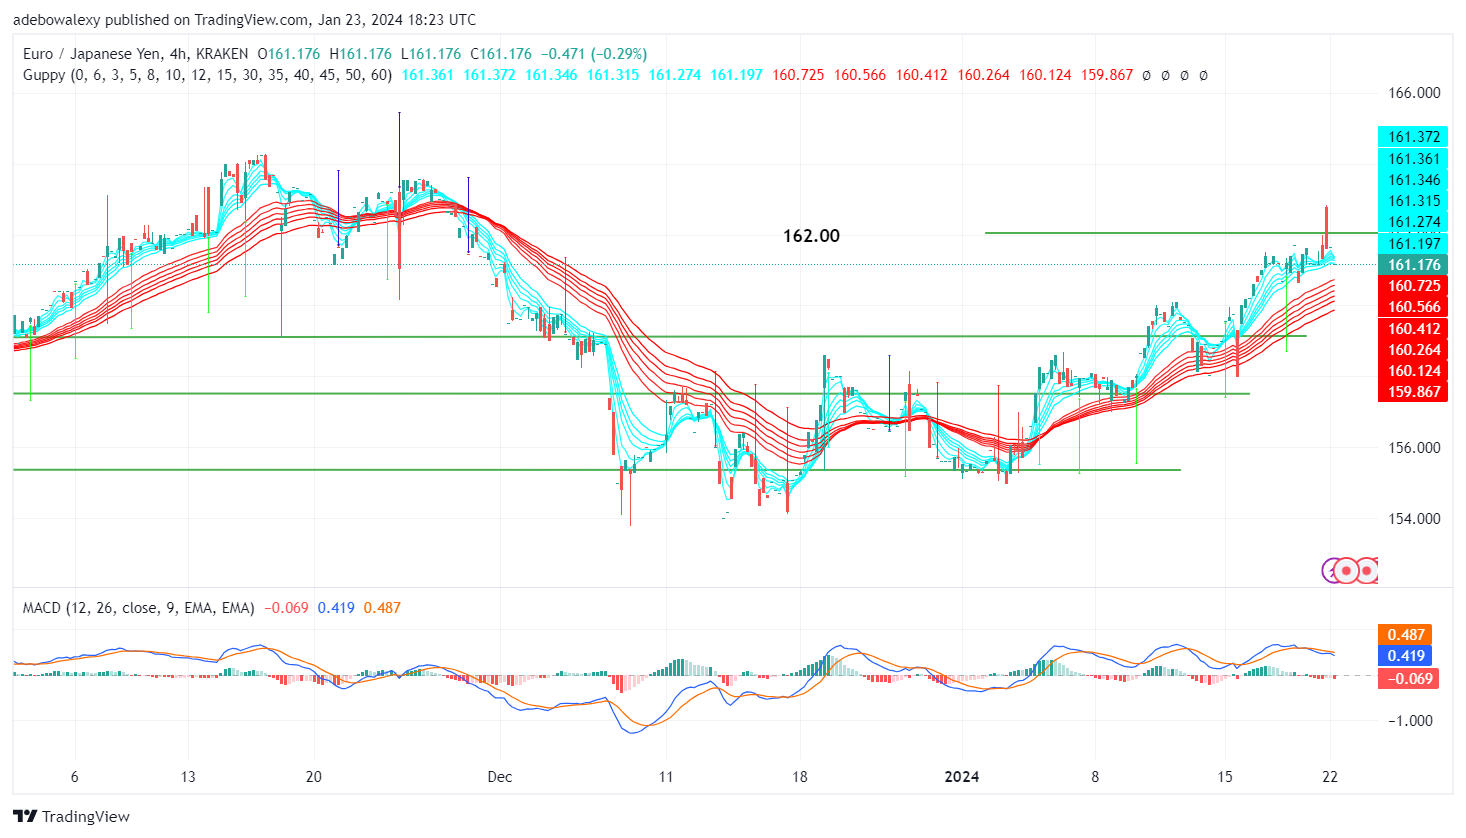
Price activity in the EURJPY has been quite impressive since the previous week. The pair even delivered a more impressive performance in yesterday’s trading session. However, it seems that yesterday’s price movement triggered some headwinds when it poked through the resistance at the 162 price level.
Key Price Levels:
Resistance Levels: 1.2700, 1.2800, and 1.2900
Support Levels: 1.2697, 1.2600, and 1.2500

EURJPY Takes a Bearish Path
Price activity in the EURJPY daily market has started falling below notable technical and market landmarks. Following a considerable downward correction that occurred in the previous session, the ongoing session has echoed further price declines. The last price candle on this chart has pushed prices below two of the green Guppy Multiple Moving Average (GMMA) lines.
This reveals that headwinds have started a decisive downward correction. The Moving Average Convergence Divergence (MACD) lines are still above the equilibrium level, but the leading line has started correcting downward. Also, the indicator bars that appear above the equilibrium level are now pale green, hinting that downward forces are gaining more ground.

EURJPY Downward Correction May Grow Stronger Here on Out
With the aid of a dashed-shaped green price candle, the current price of EURJPY now lies below the green set of the GMMA indicator lines. Consequently, this signals that bearish momentum is gaining ground. There is thinning participation in the ongoing session, which limits the hope of a considerable rebound off the red set of the GMMA indicator lines.
Meanwhile, the MACD indicator lines are also above the equilibrium level but seem to have a downward path. It can also be seen that a red bar has appeared below the equilibrium level. As a result, this strengthens bearish anticipation of a steeper downward correction towards the support level at the 161.00 mark.
Do you want to take your trading to the next level? Join the best platform for that here.


Leave a Reply